
Building the New Play Map Version 3.0
Update # 2
The next iteration of the New Play Map is on the way! We have completed the second of four “sprints” with our web developers, Quilted. We want to keep you informed of our progress as it happens, so keep an eye out for regular posts. If you want to see the first one, you can find it here.
Developers Kiran, Chacha, Colin, and Ben contributed to make this update. We set a number of goals for this sprint. We'll update goal-by-goal:
It is going to look really good and it is going to work better.
Ensure the system allows users to paste a url and share it In the last version of the Map we were having some problems with sharing specific url’s from the site and having the information we wanted to display show up consistently. Thus, the team went back to the original code and wrote a router that is more organized and stable so that there is more control about what is displayed and how.
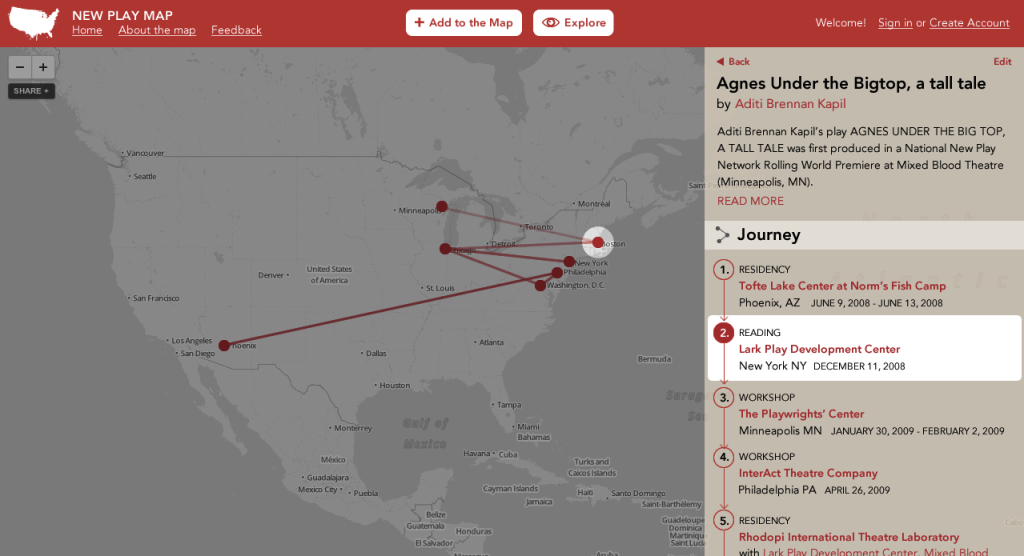
Make a decision about what play journeys should look like Because we are using a new and improved mapping technology that impacts the display of the play journeys, we now had to re-assess how to best illustrate this action. We worked with Ben who mocked up some awesome new design ideas that show the journey but allow the user to hover over a specific development step and to simultaneously ‘spotlight’ that information. Basically, as Ben says, “it is going to look really good and it is going to work better."
Implement the journey user interface decision This is tied into the goal above. We started to look at how to show the movement from one development step to the next in a way that shows both how the development steps are related to each other in geographical space and chronologically. We decided to try using a contrail line that becomes more opaque the more recent the event. We were able to see proof of concept of this idea.
Begin to look at what the filters should look like There is now so much information on the map that it cannot display all of this information at once. Even if it tried to load only the play events, the overwhelming amount of data would crash your browser. This was part of the reason we spent the first sprint translating all of the map data into GeoJSON format that is easier to parse. This sprint we started using a free hosted MongoLab server, which is a kind of database that stores structured data. Essentially, we have put the information into a database that JavaScript can talk with really quickly. This means that as we move forward with perfecting the map’s filtering and searching capabilities, we now have this set up in the back end which should facilitate much quicker exploring and displaying of information on the Map.
In short, progress! We continue our third sprint this week. Can’t wait to update on what happens next!


Comments
The article is just the start of the conversation—we want to know what you think about this subject, too! HowlRound is a space for knowledge-sharing, and we welcome spirited, thoughtful, and on-topic dialogue. Find our full comments policy here