
A note before we dive in: There’s no elegant and short way yet to say “designers-whose-pronouns-are-‘he’ designers,” so for the purposes of this article, I’m going to say “he designers,” “she designers,” and “they designers,” and same for artistic directors and directors.
Who Designs and Directs in LORT Theatres by Pronoun: 2019
Essay by
Trends and Takeaways
It’s the fifth year of this study! Are we getting closer to gender parity in design in LORT theatres?
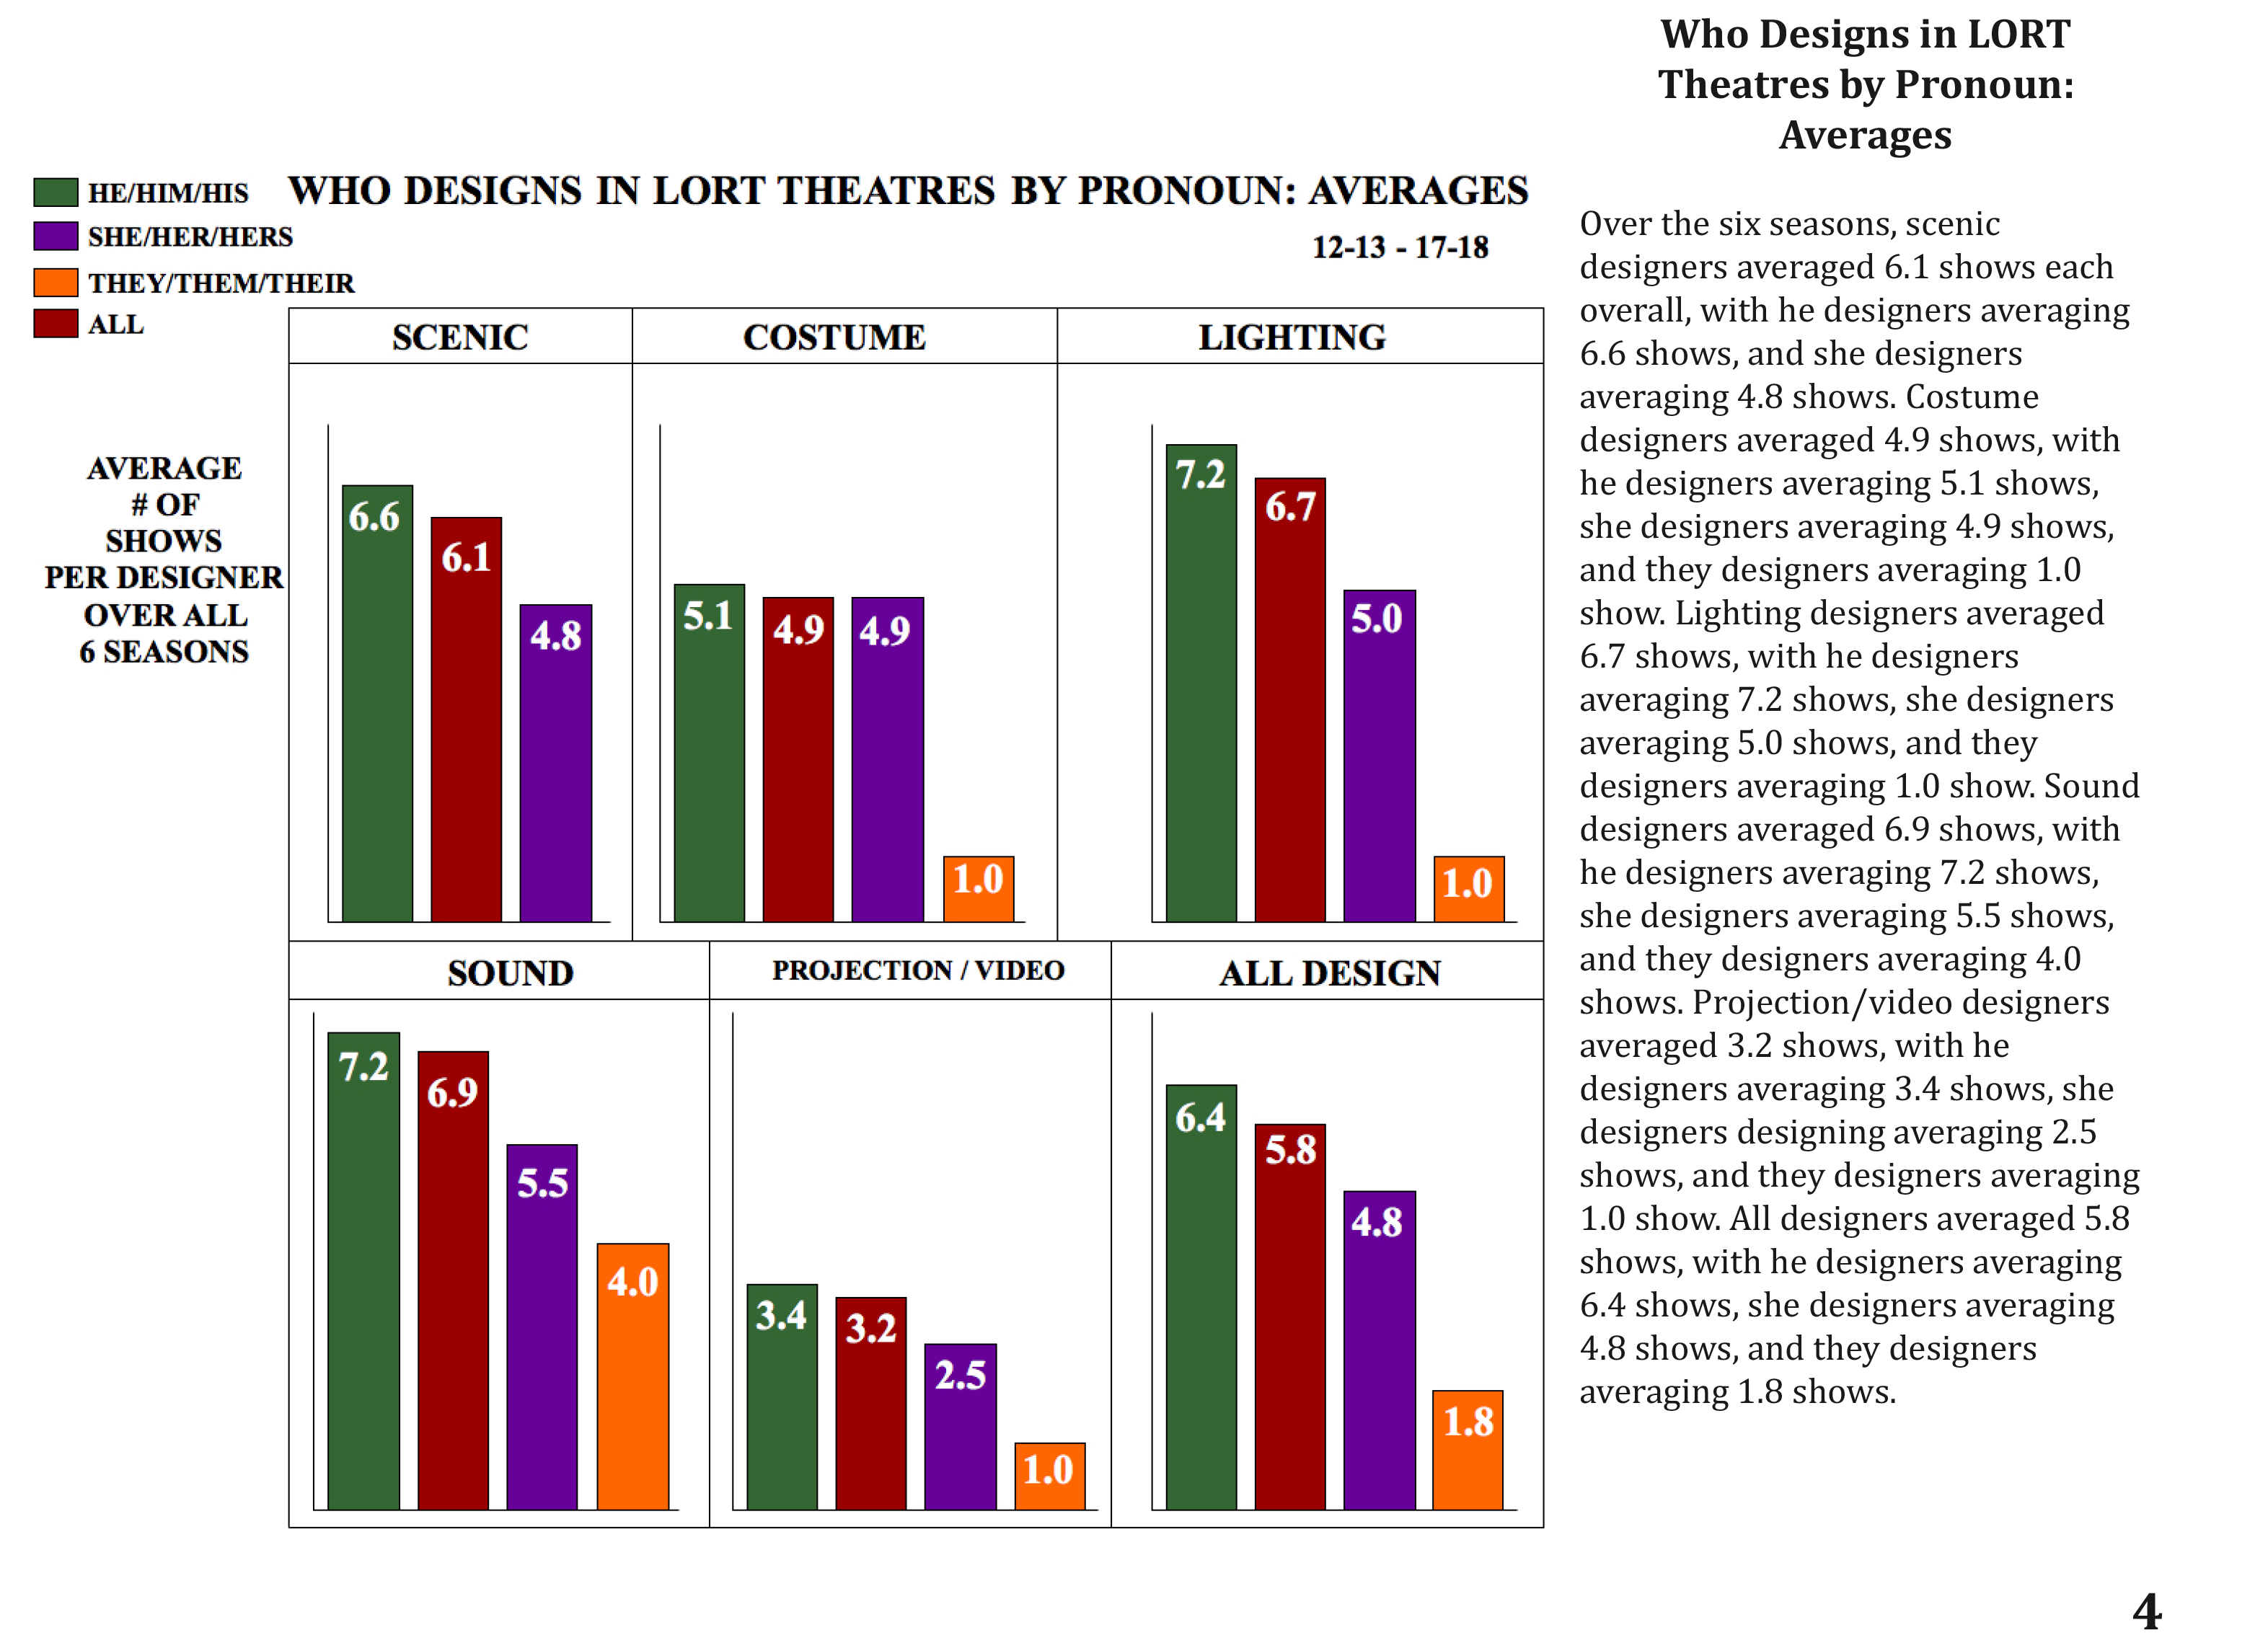
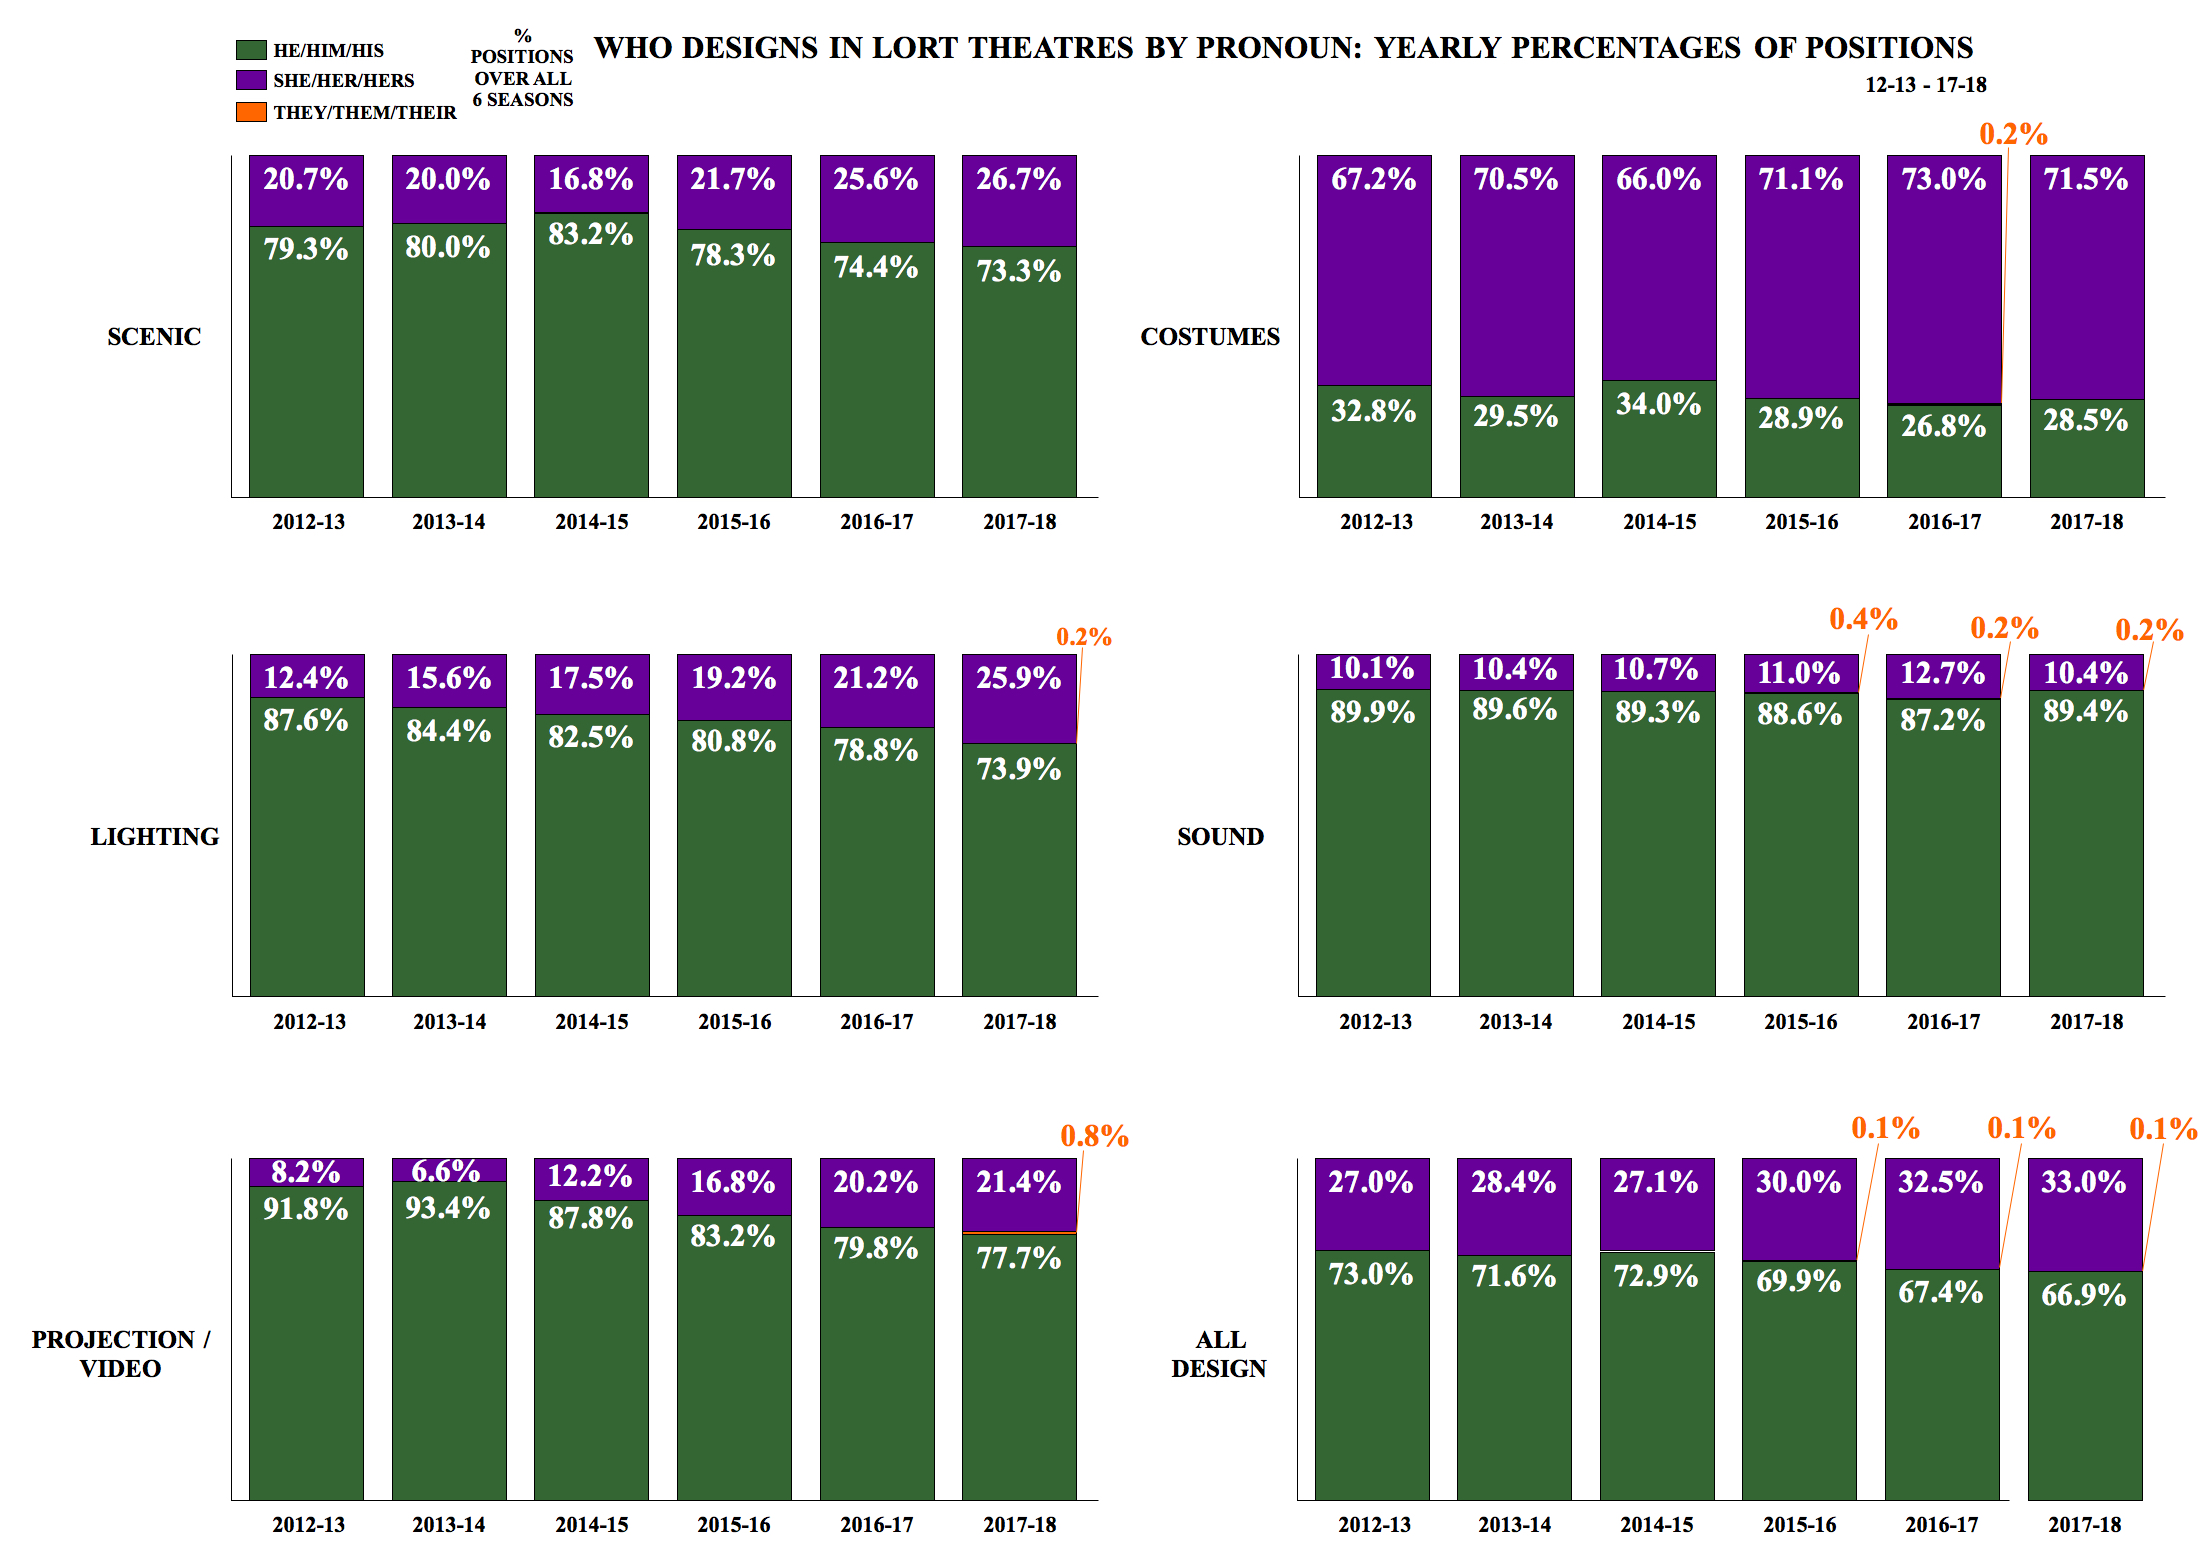
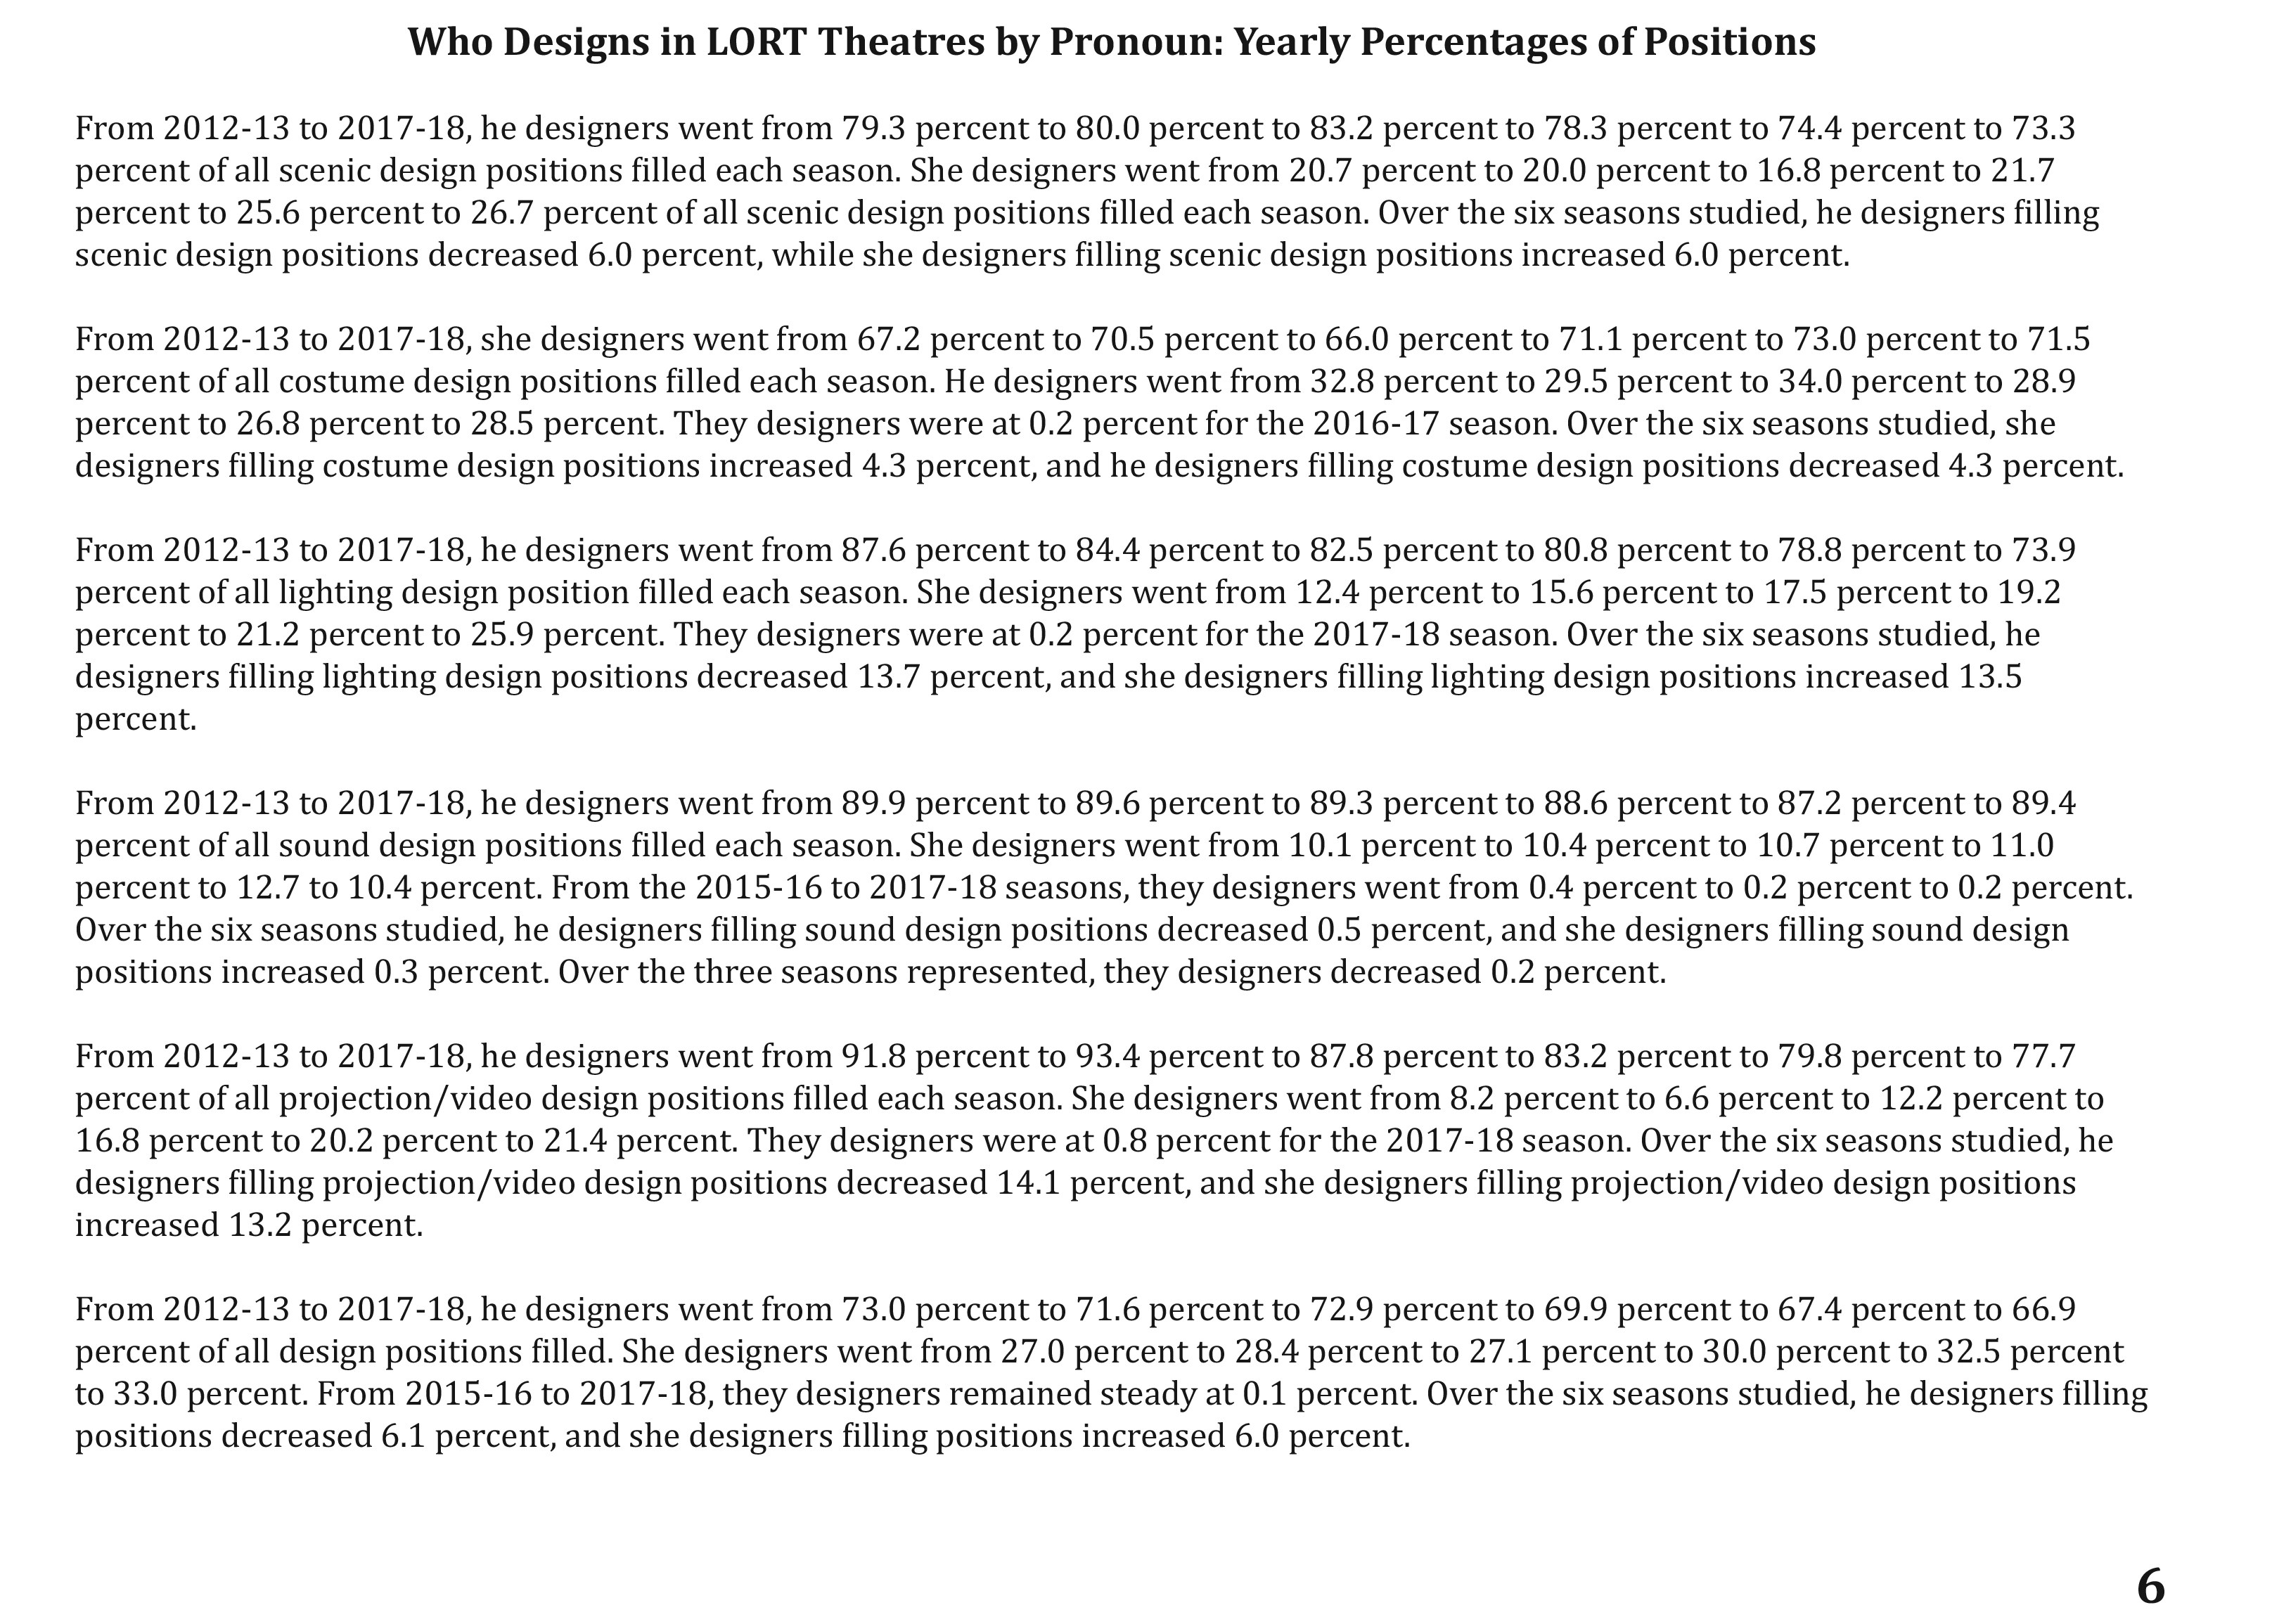
The short answer is yes, albeit very slowly and with a good chunk of caveats. Over the six seasons, the percentage of she designers in positions increased 6.0 percent overall to 33.0 percent. Individual disciplines varied. In lighting and projection/video, the percentage of she designers in positions more than doubled. But the percentage of she designers in sound design positions only went up by 0.3 percent.
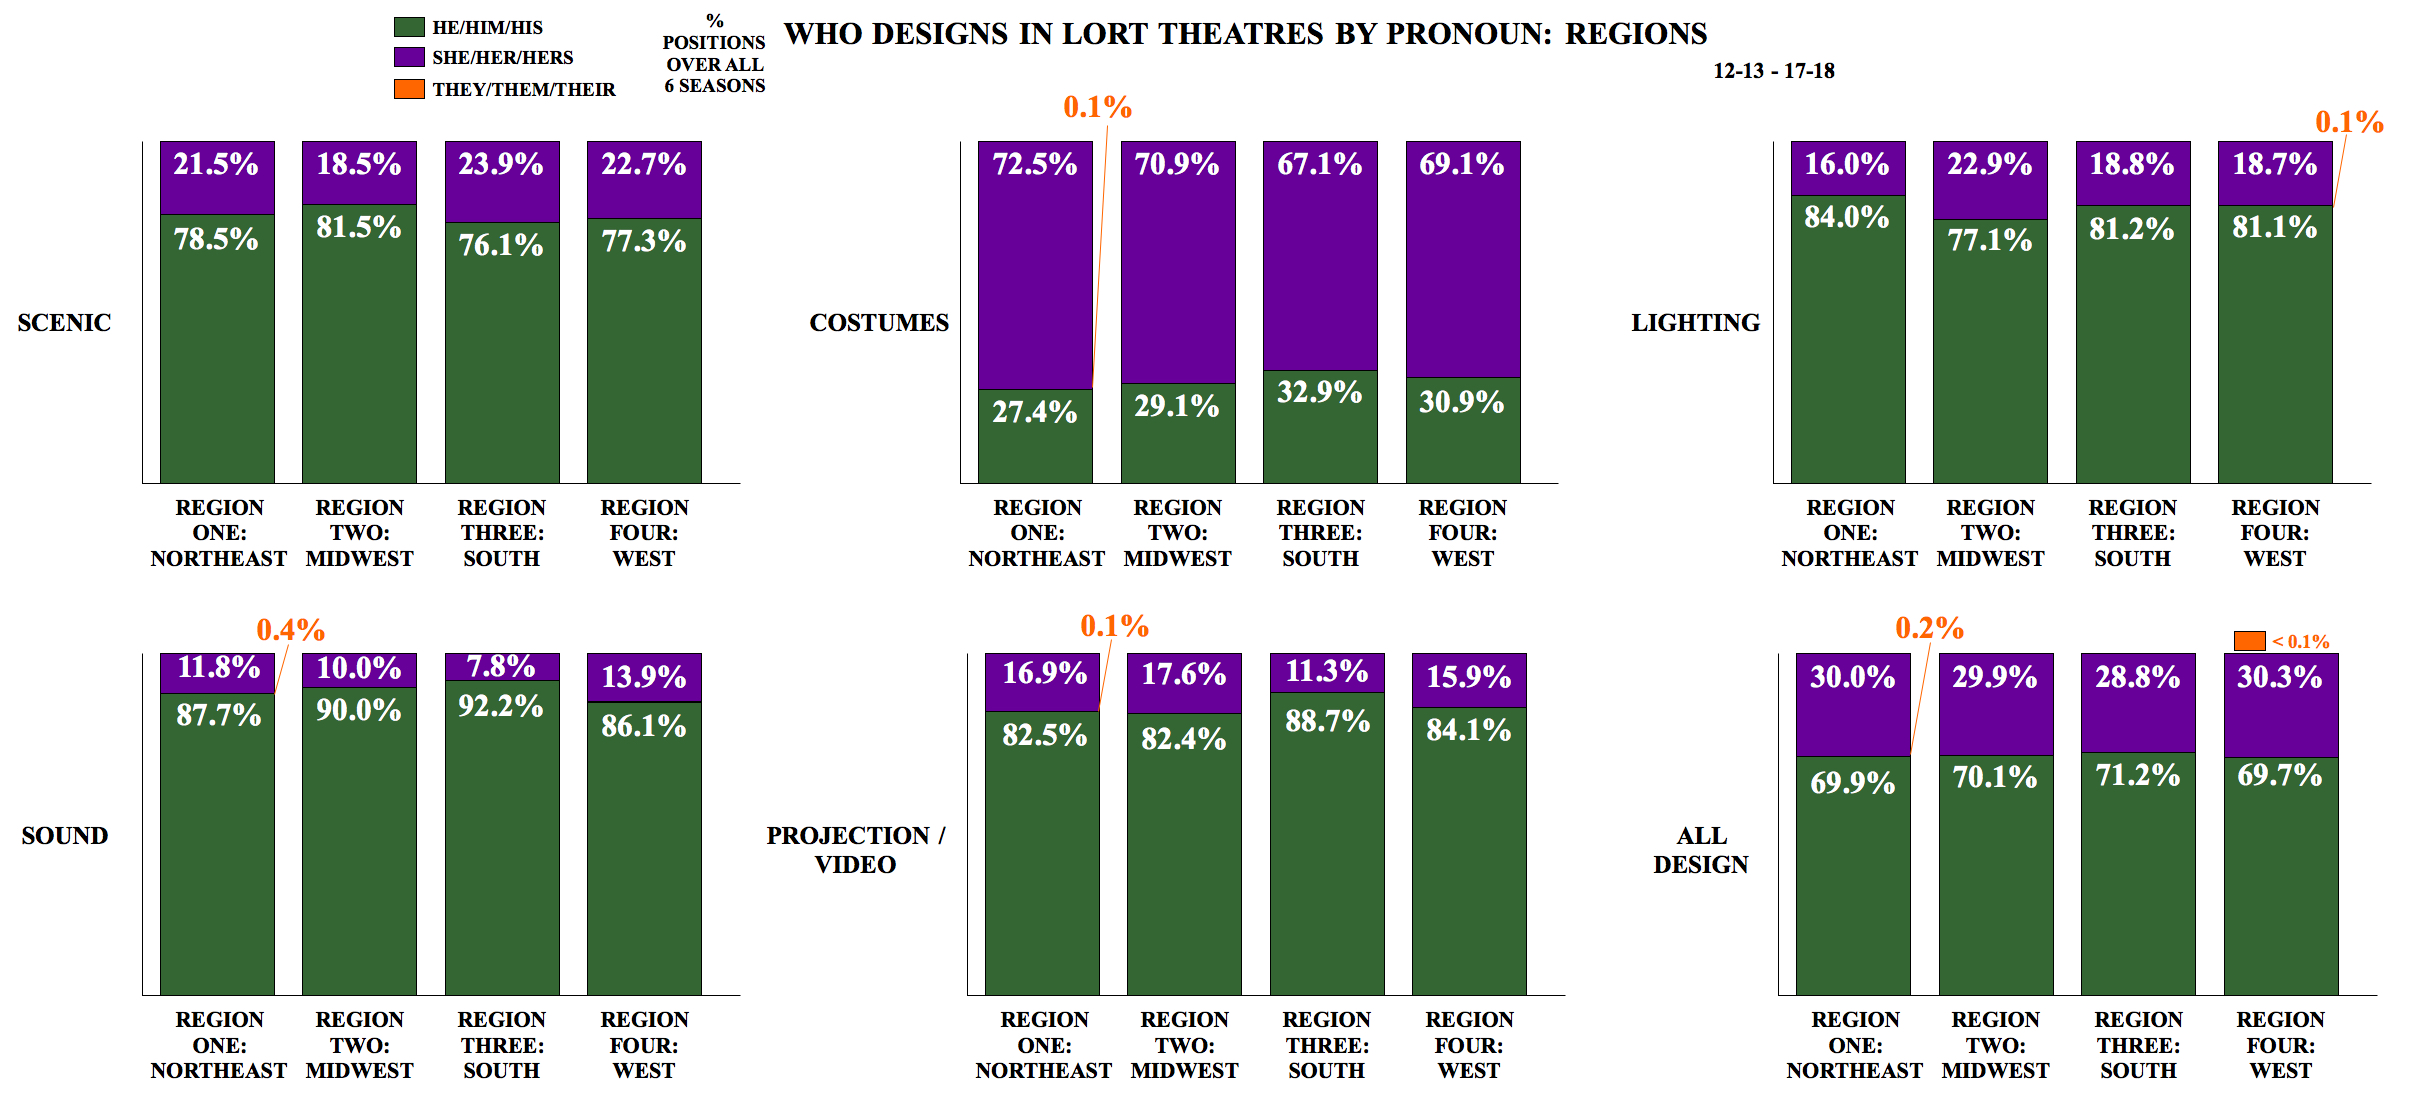
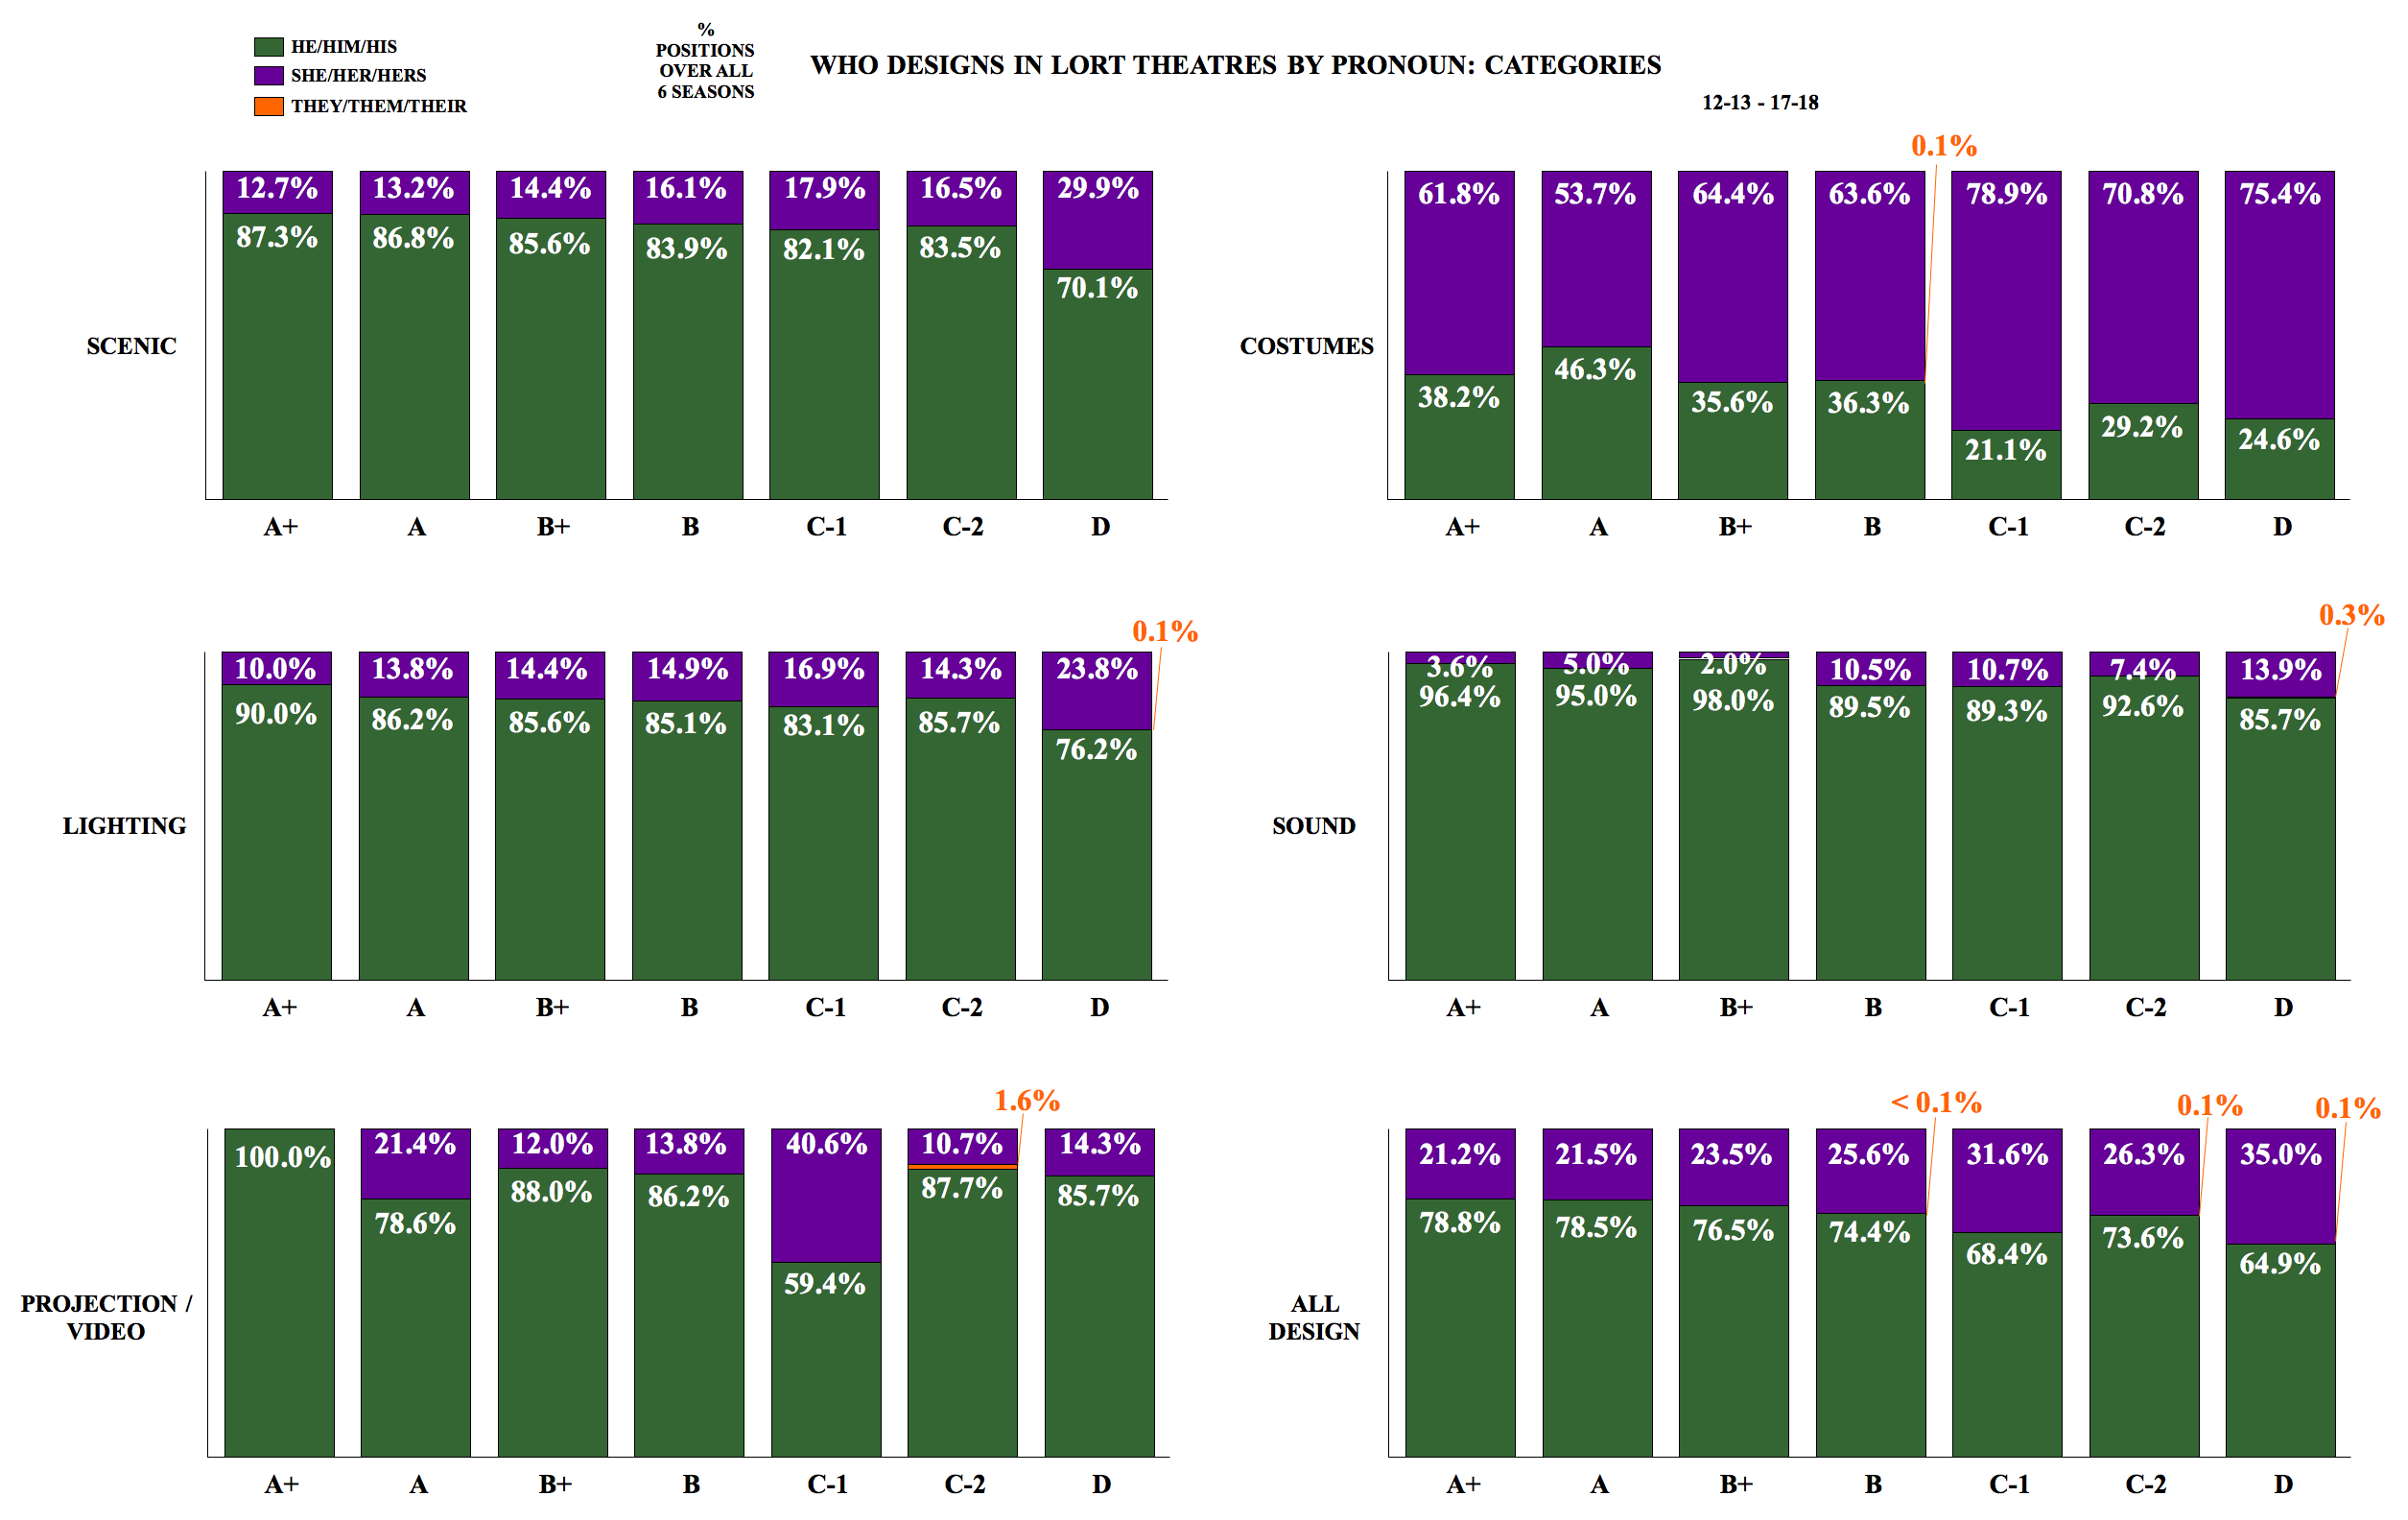
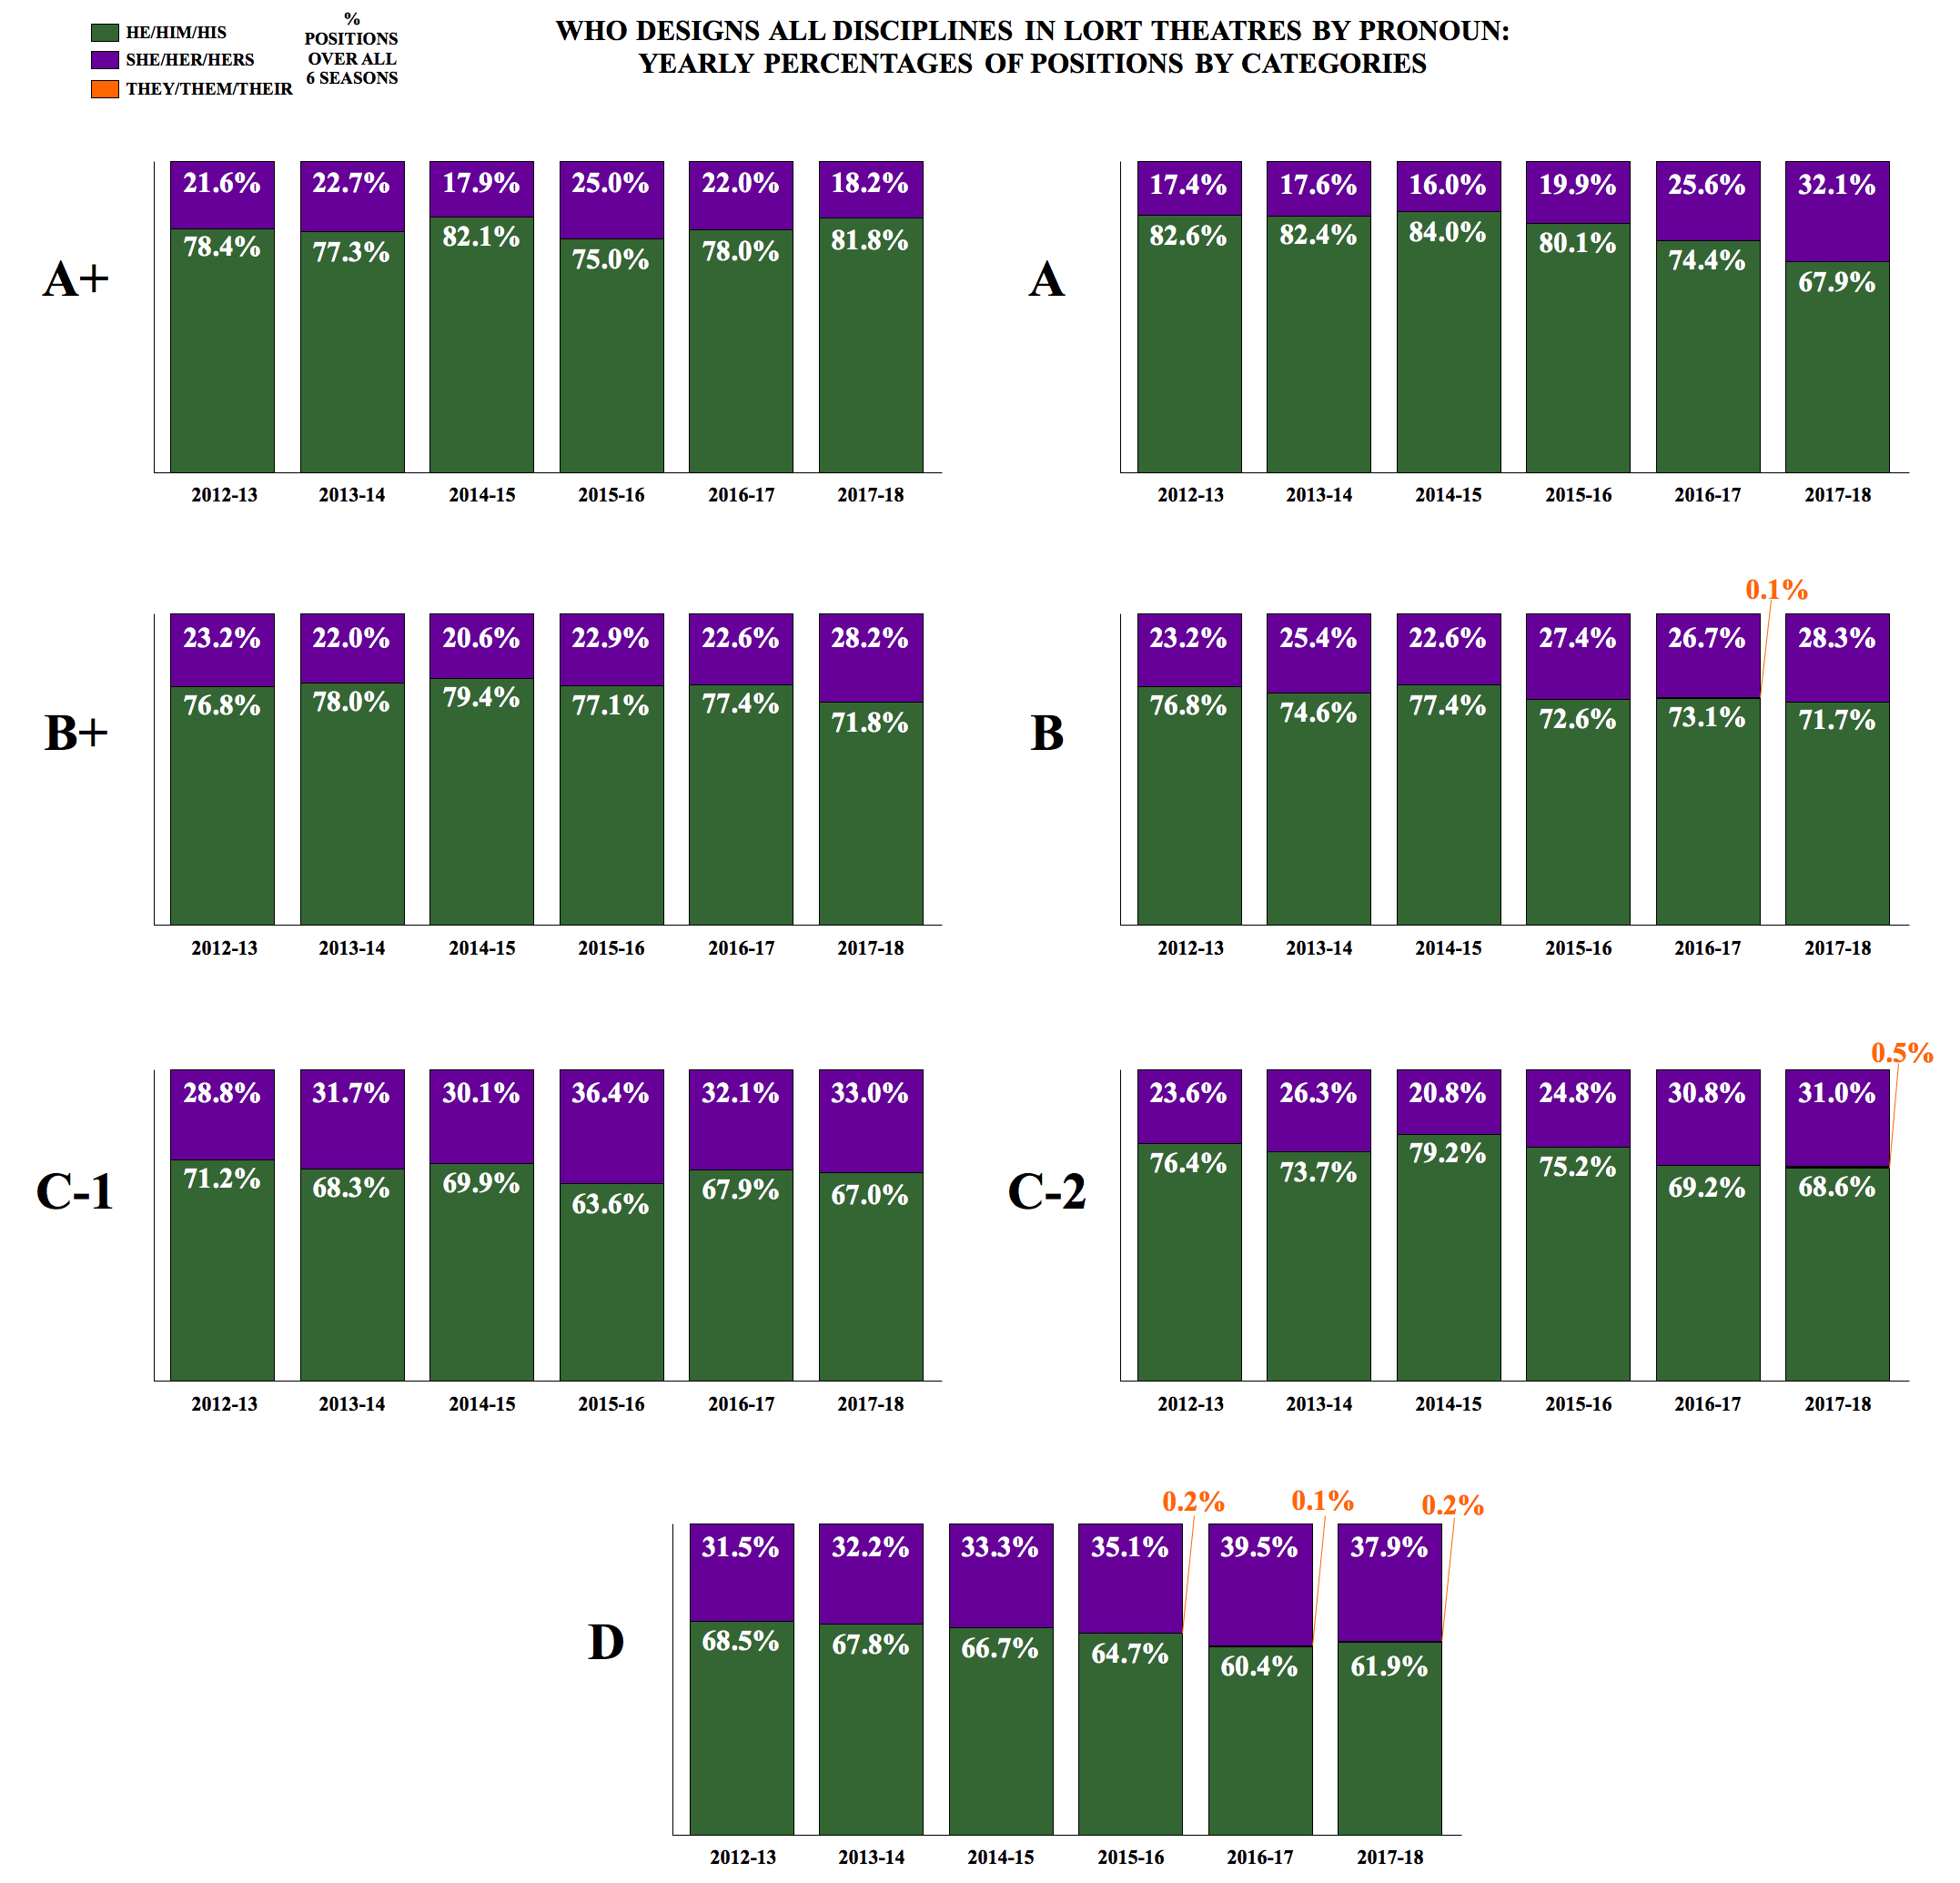
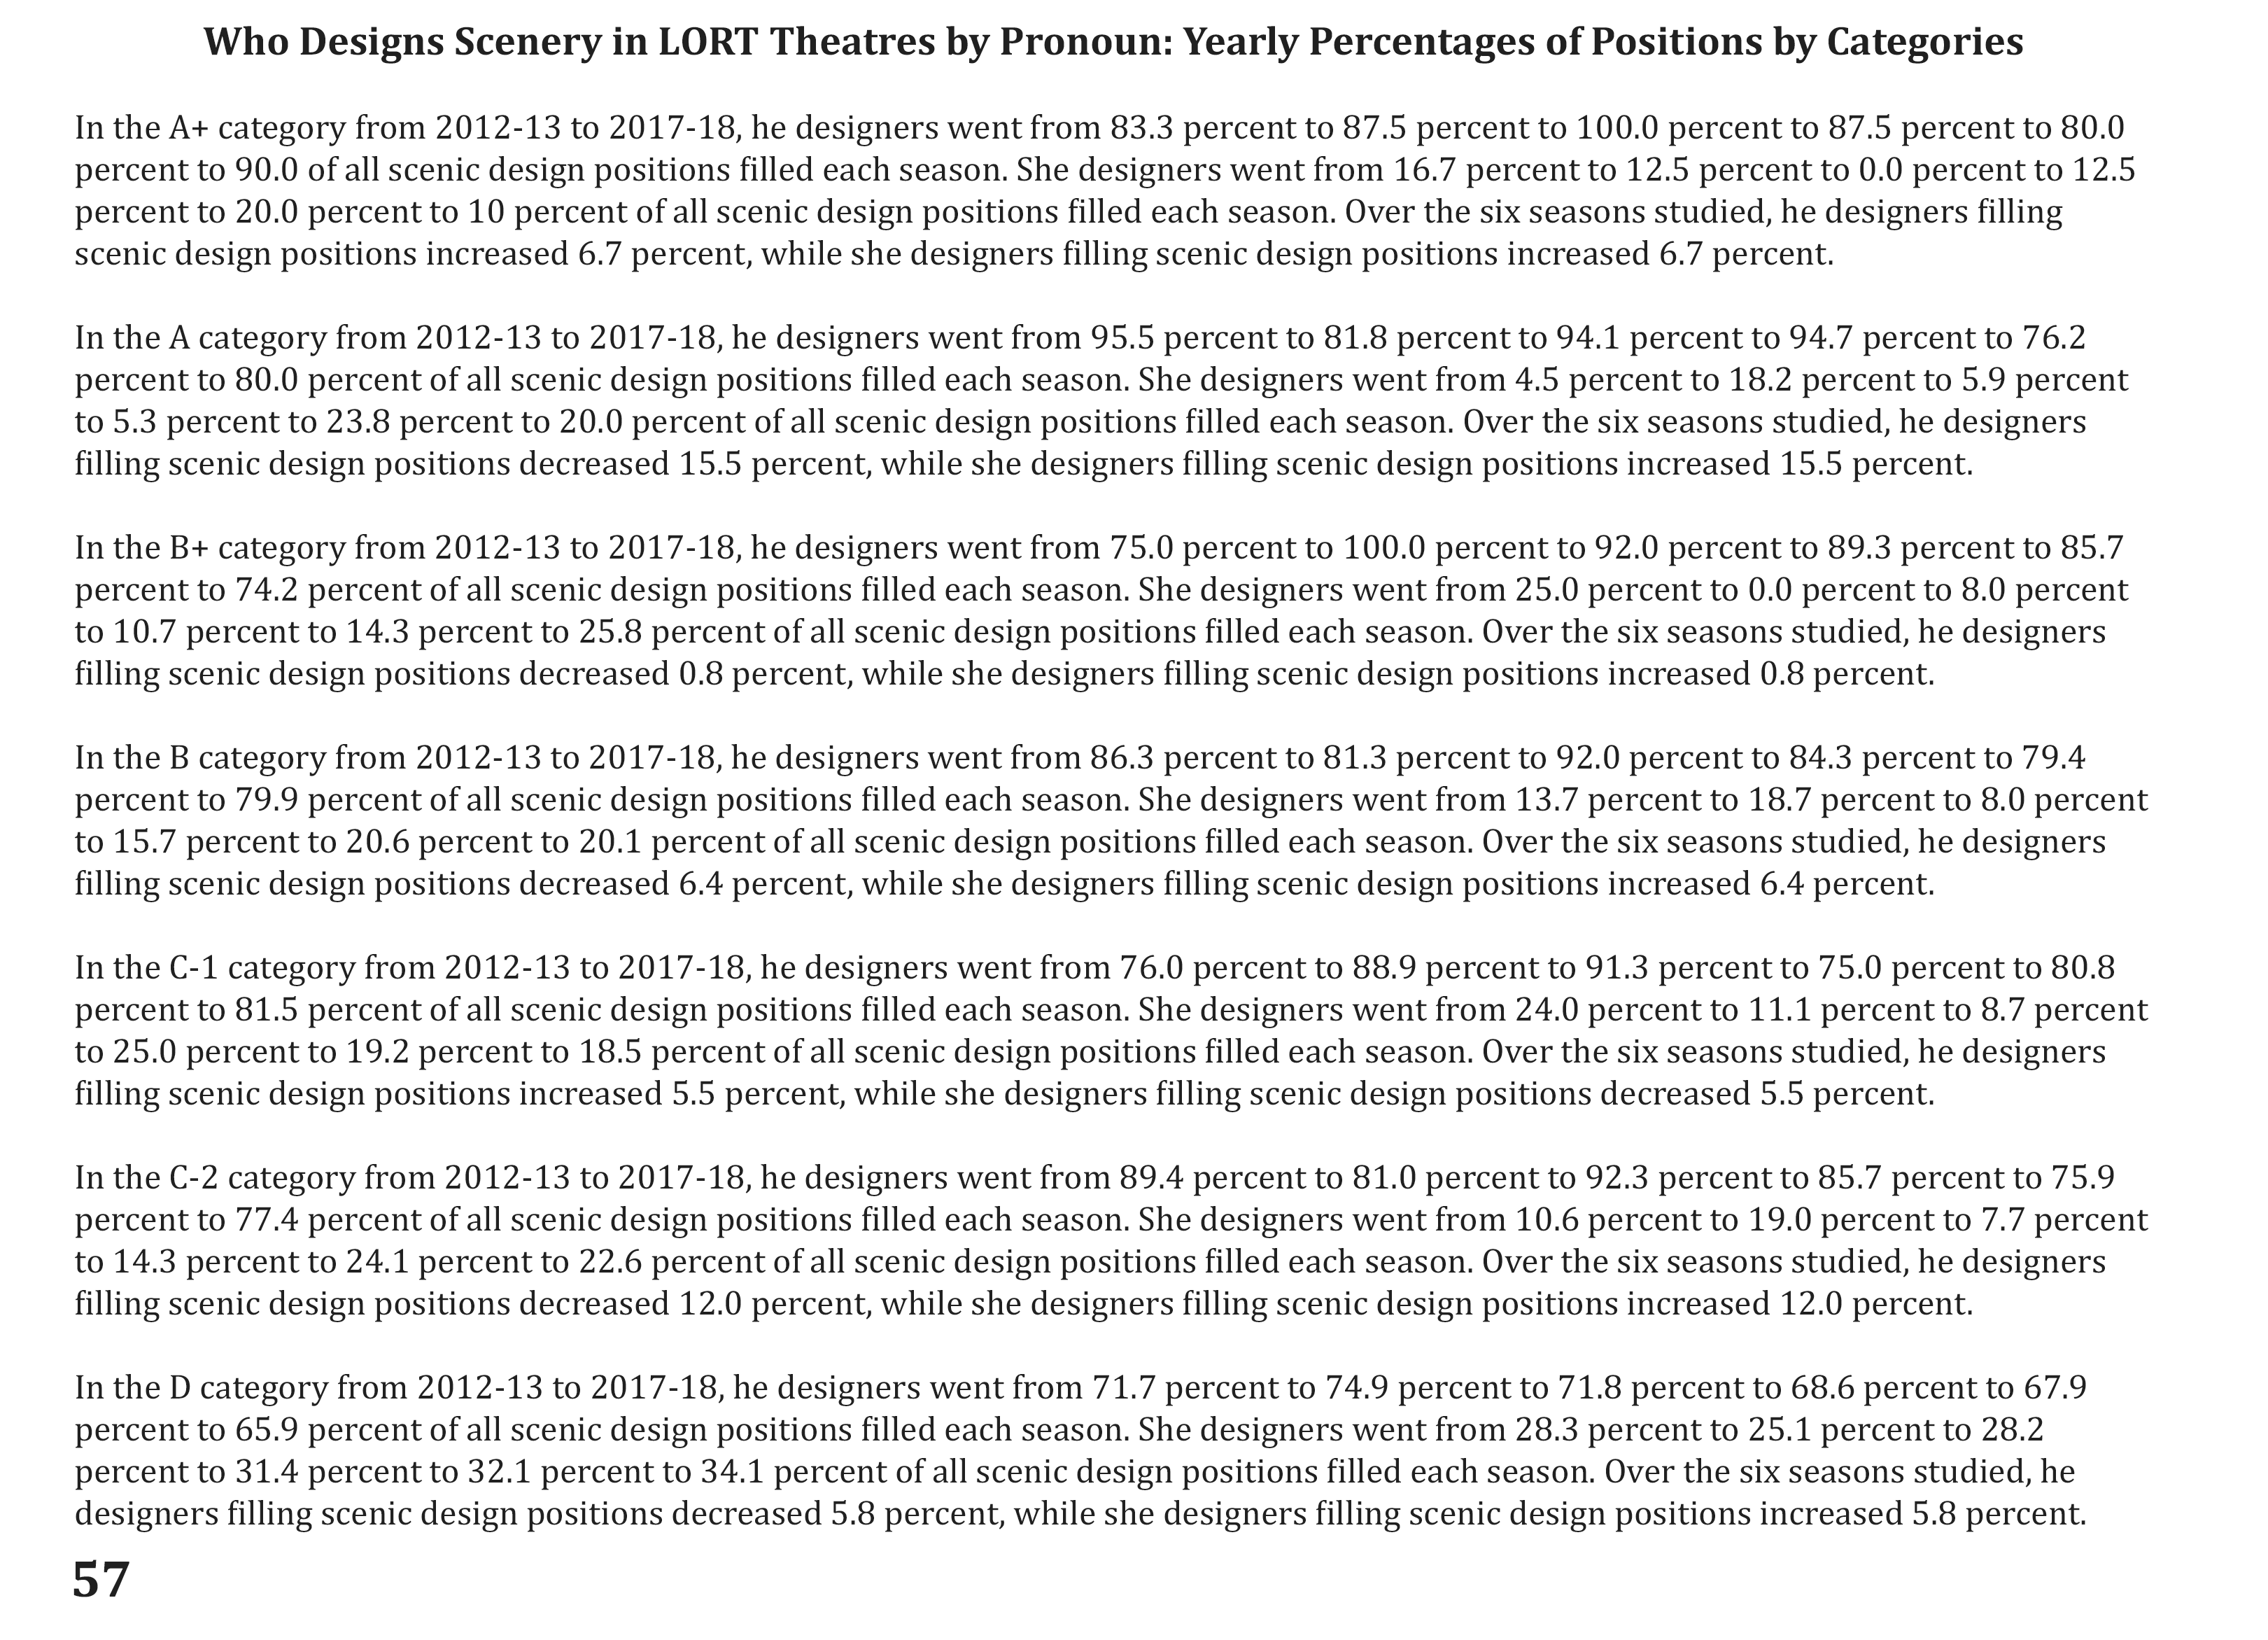
LORT Stage Categories are determined by the LORT-AEA agreement (weekly box office receipts and Tony award eligibility) and the LORT-SDC agreement (C category divided into two categories by number of seats—you can look here for more information on minimum rates for designers based on LORT stage categories). As categories (and thus design minimums) get higher, the percentage of positions filled by she designers goes down. It’s not a completely consistent correlation, but it’s pretty close over all the disciplines and overall. The minimum design rate is significantly higher in A+ than in D spaces. From the A+ category to the D category, the percentages of she designers in both scenic and lighting design positions more than doubles. In sound design, it more than triples. A caveat—there are more than twenty-four times more design positions filled in D spaces than in A+ spaces.
The most prolific 1 percent of designers worked 8.2 percent of all positions available. 1069.5 positions were held by twenty-five designers total, including twenty-one he designers and four she designers. That’s an average of 42.8 shows over the six seasons, or a little over seven shows a season.
Over the six seasons, the percentage of she designers in positions increased 6.0 percent overall to 33.0 percent.
What about directing?
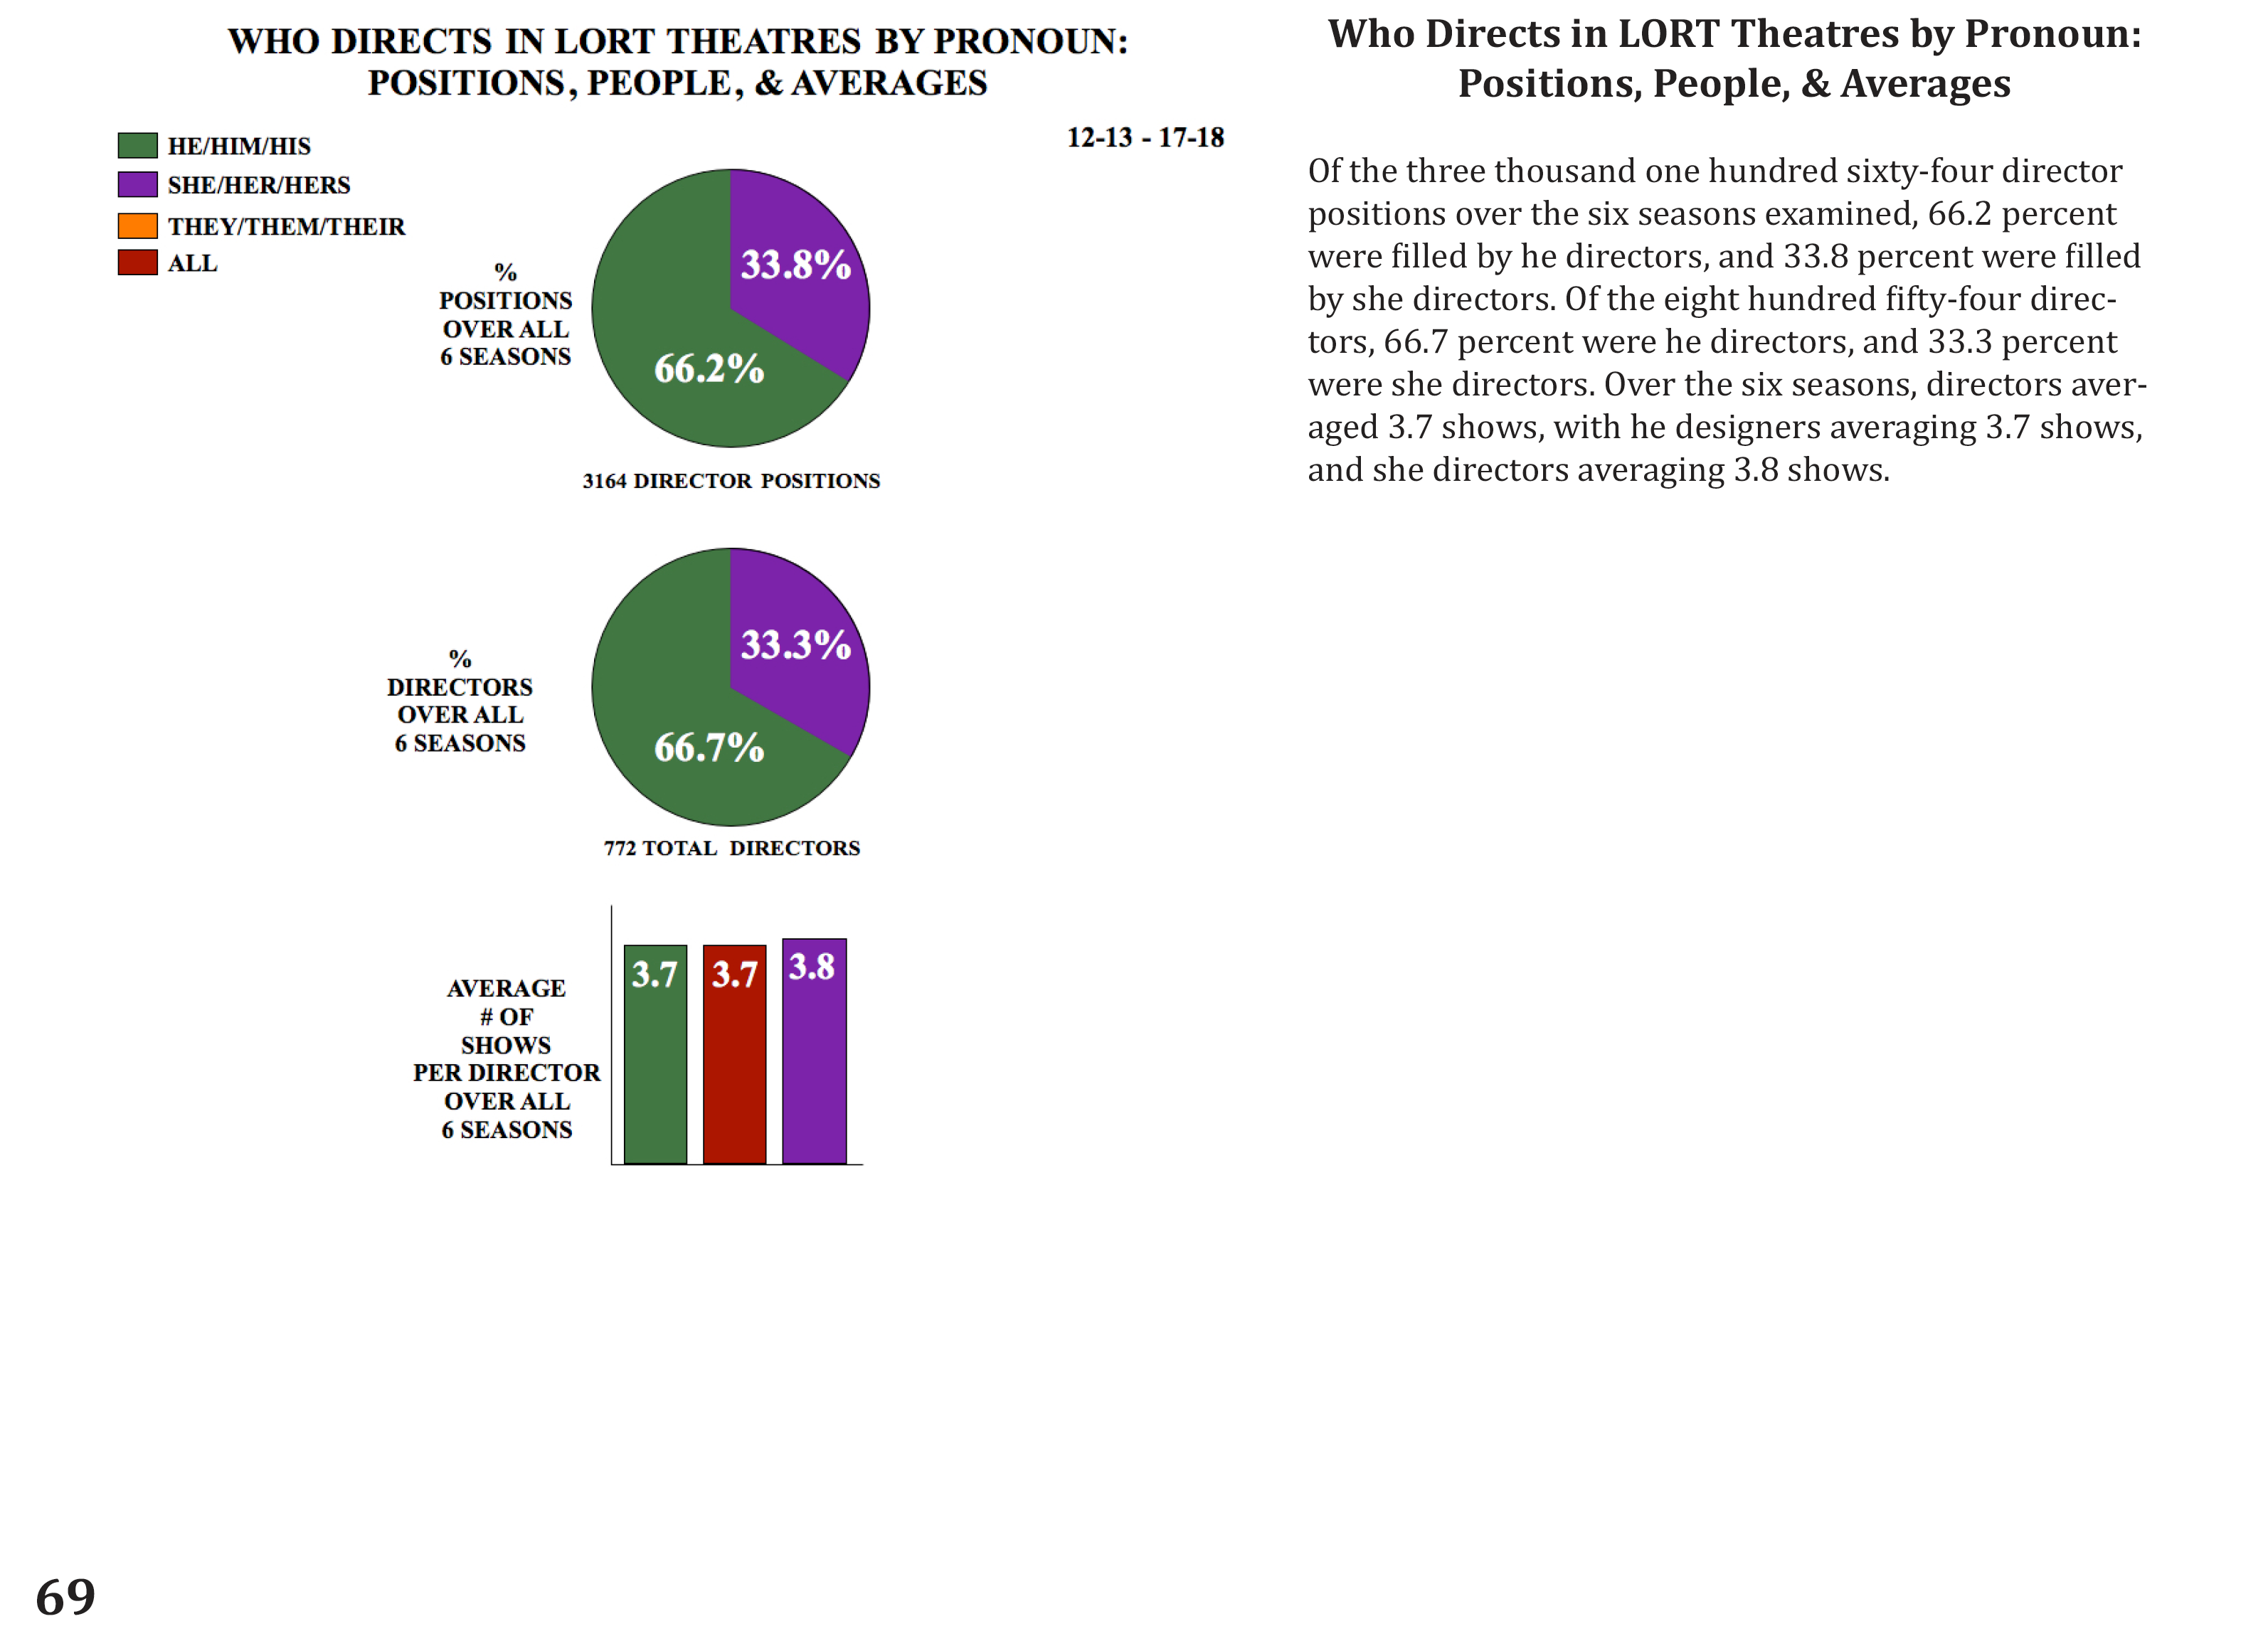
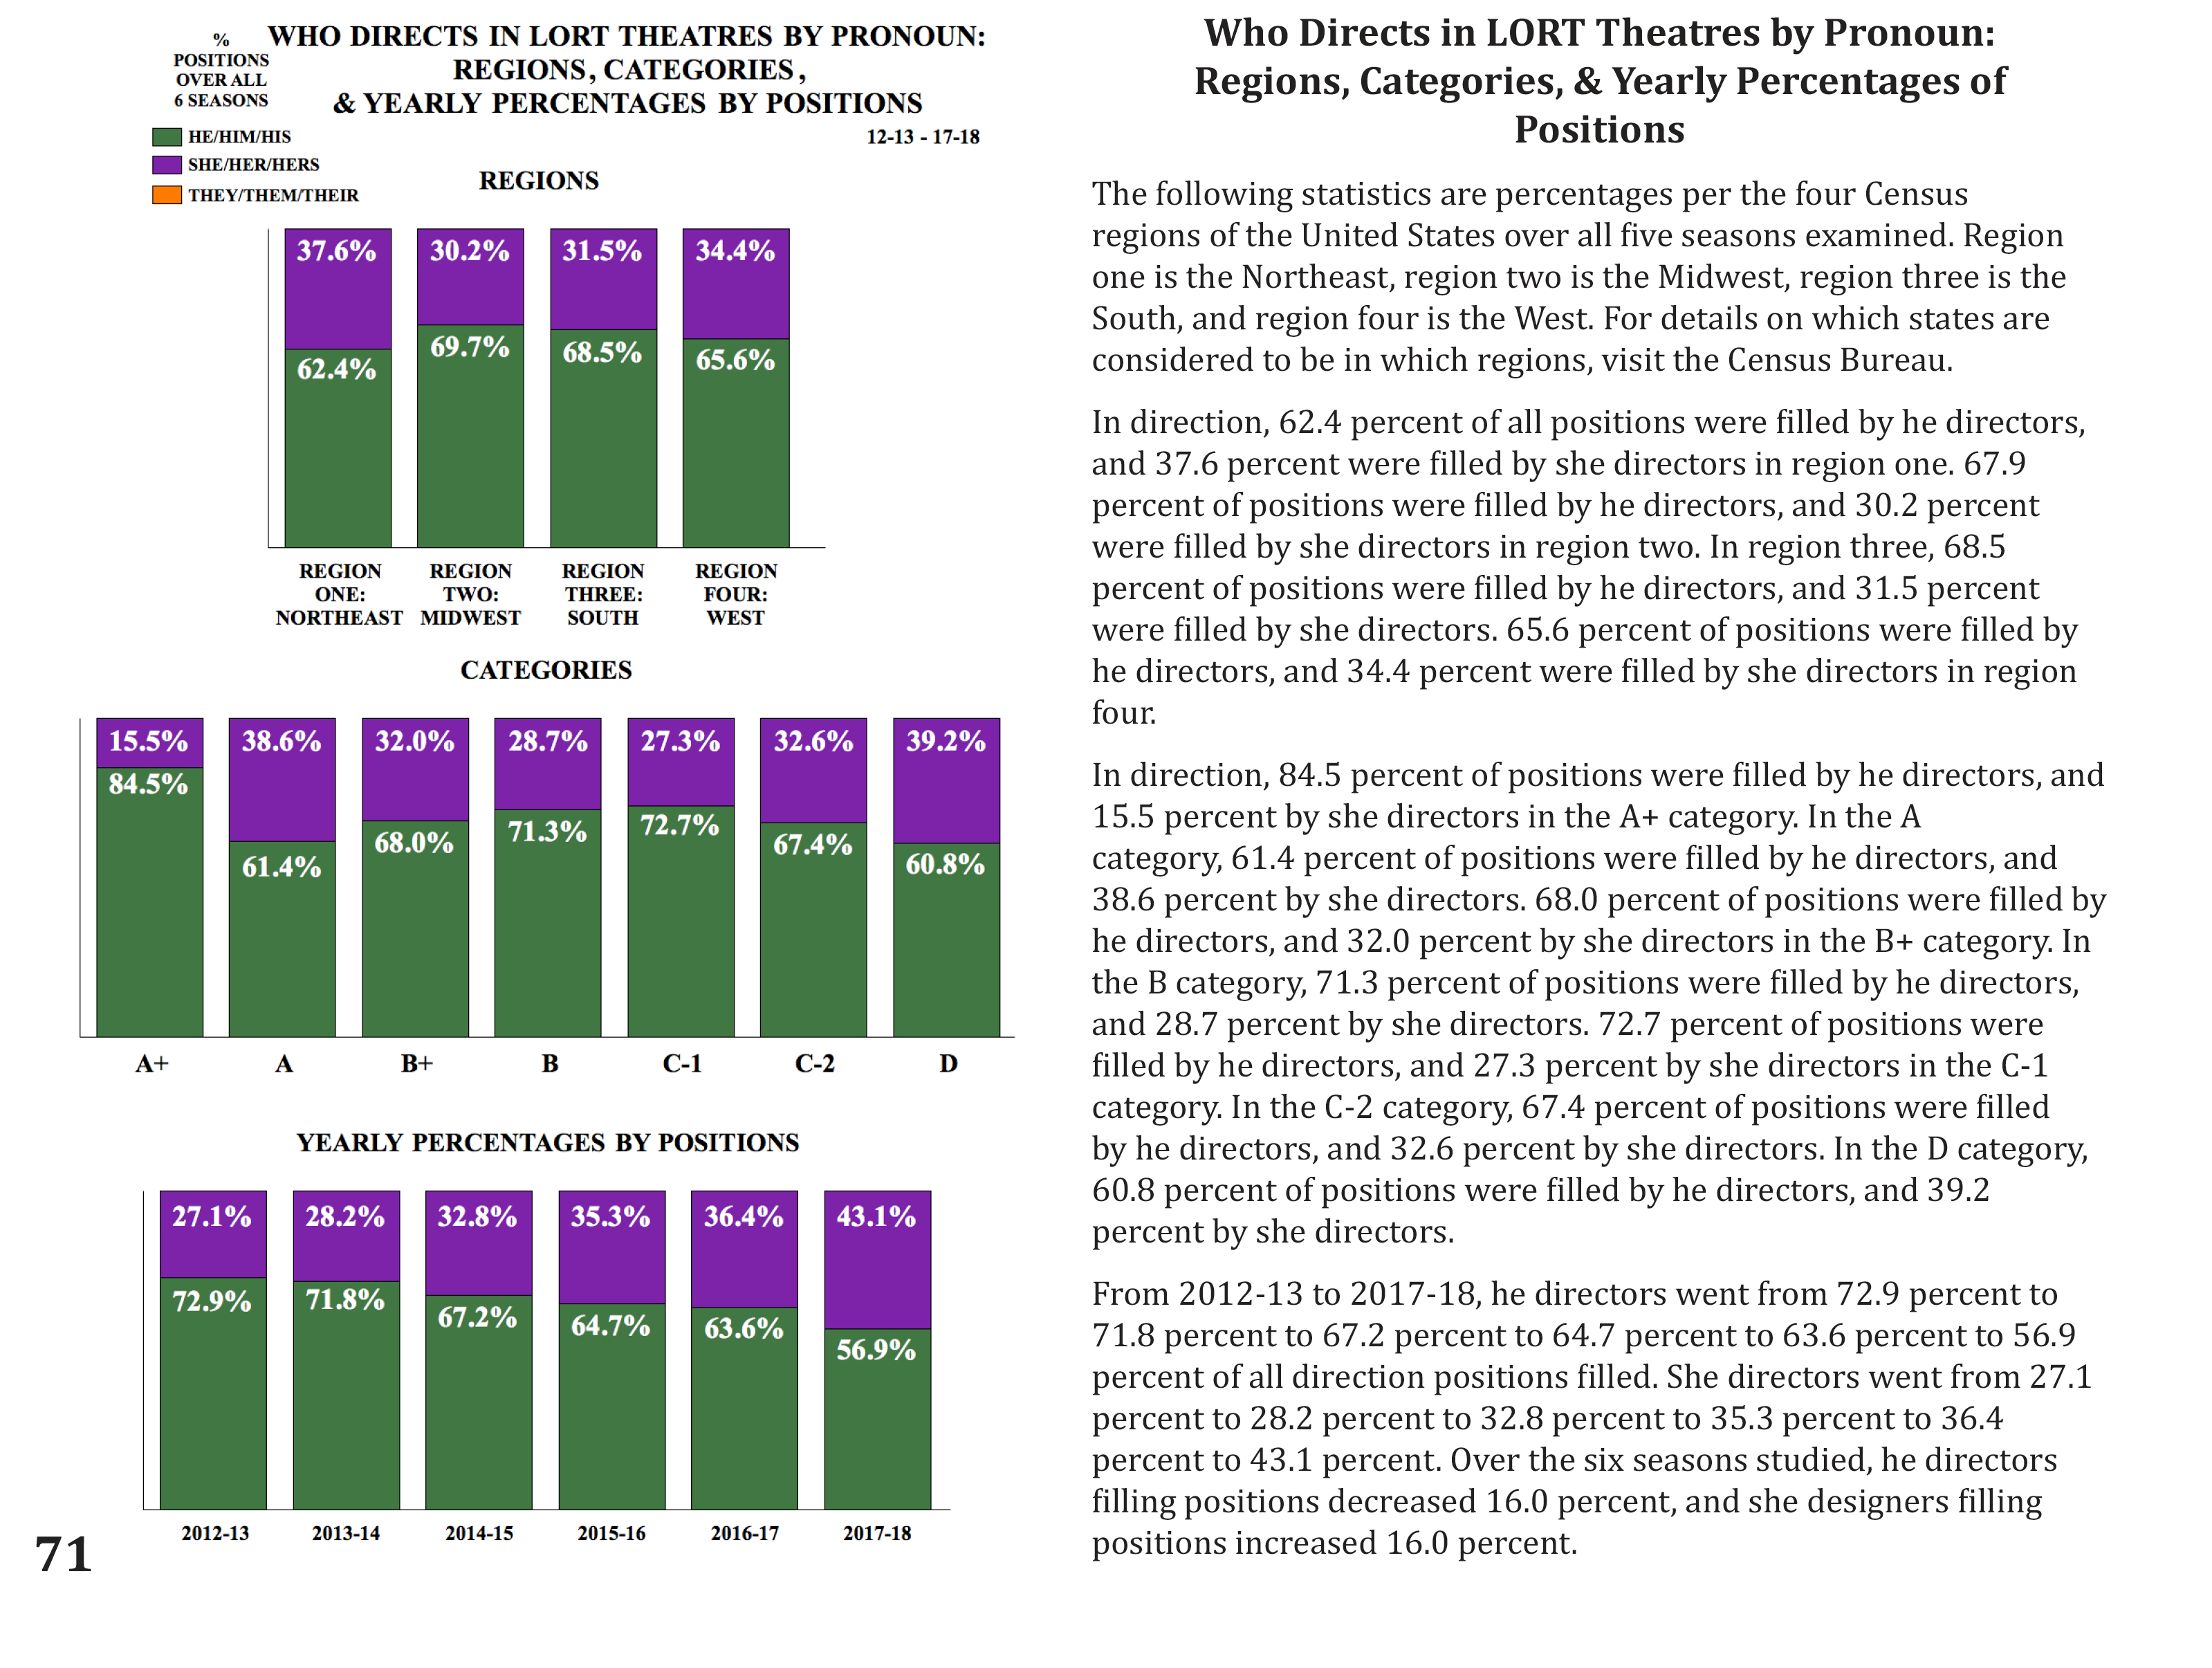
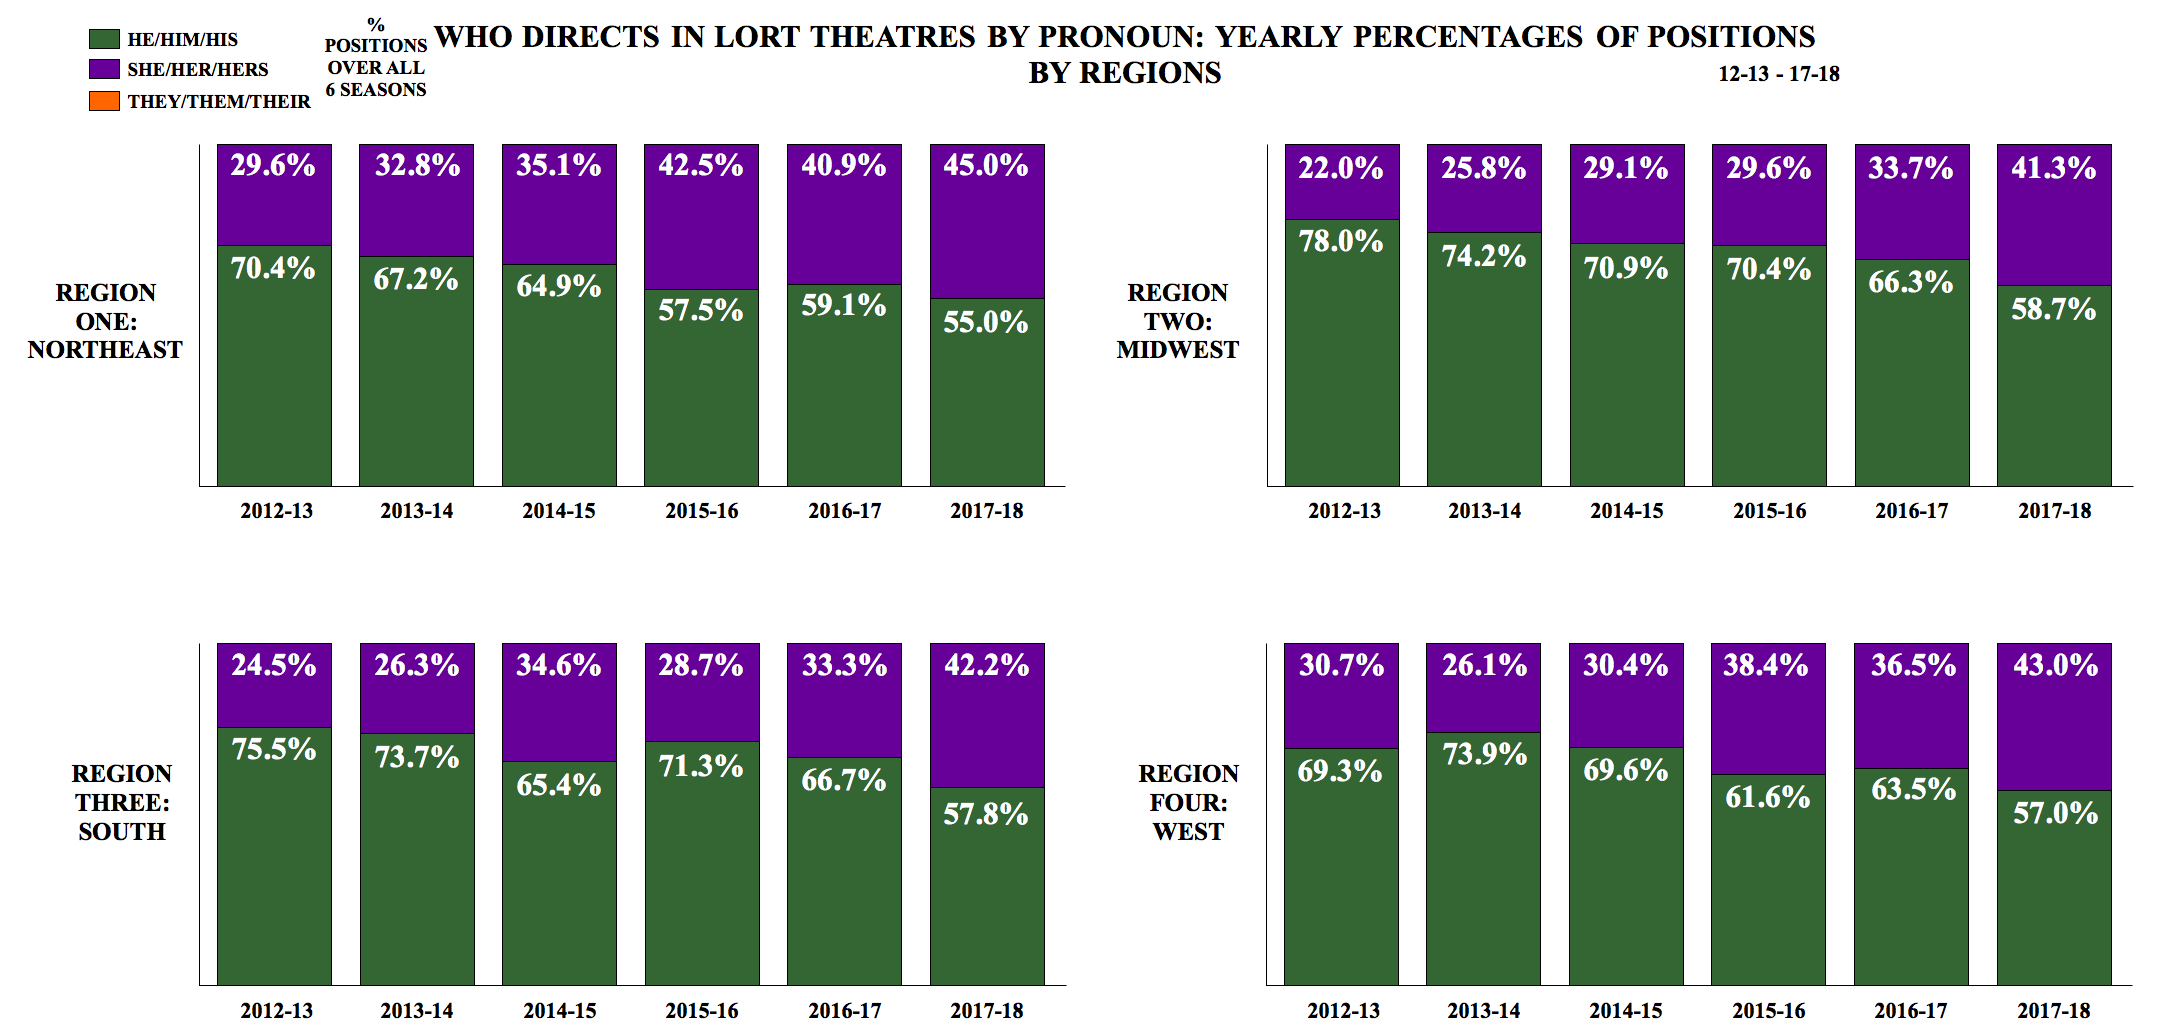
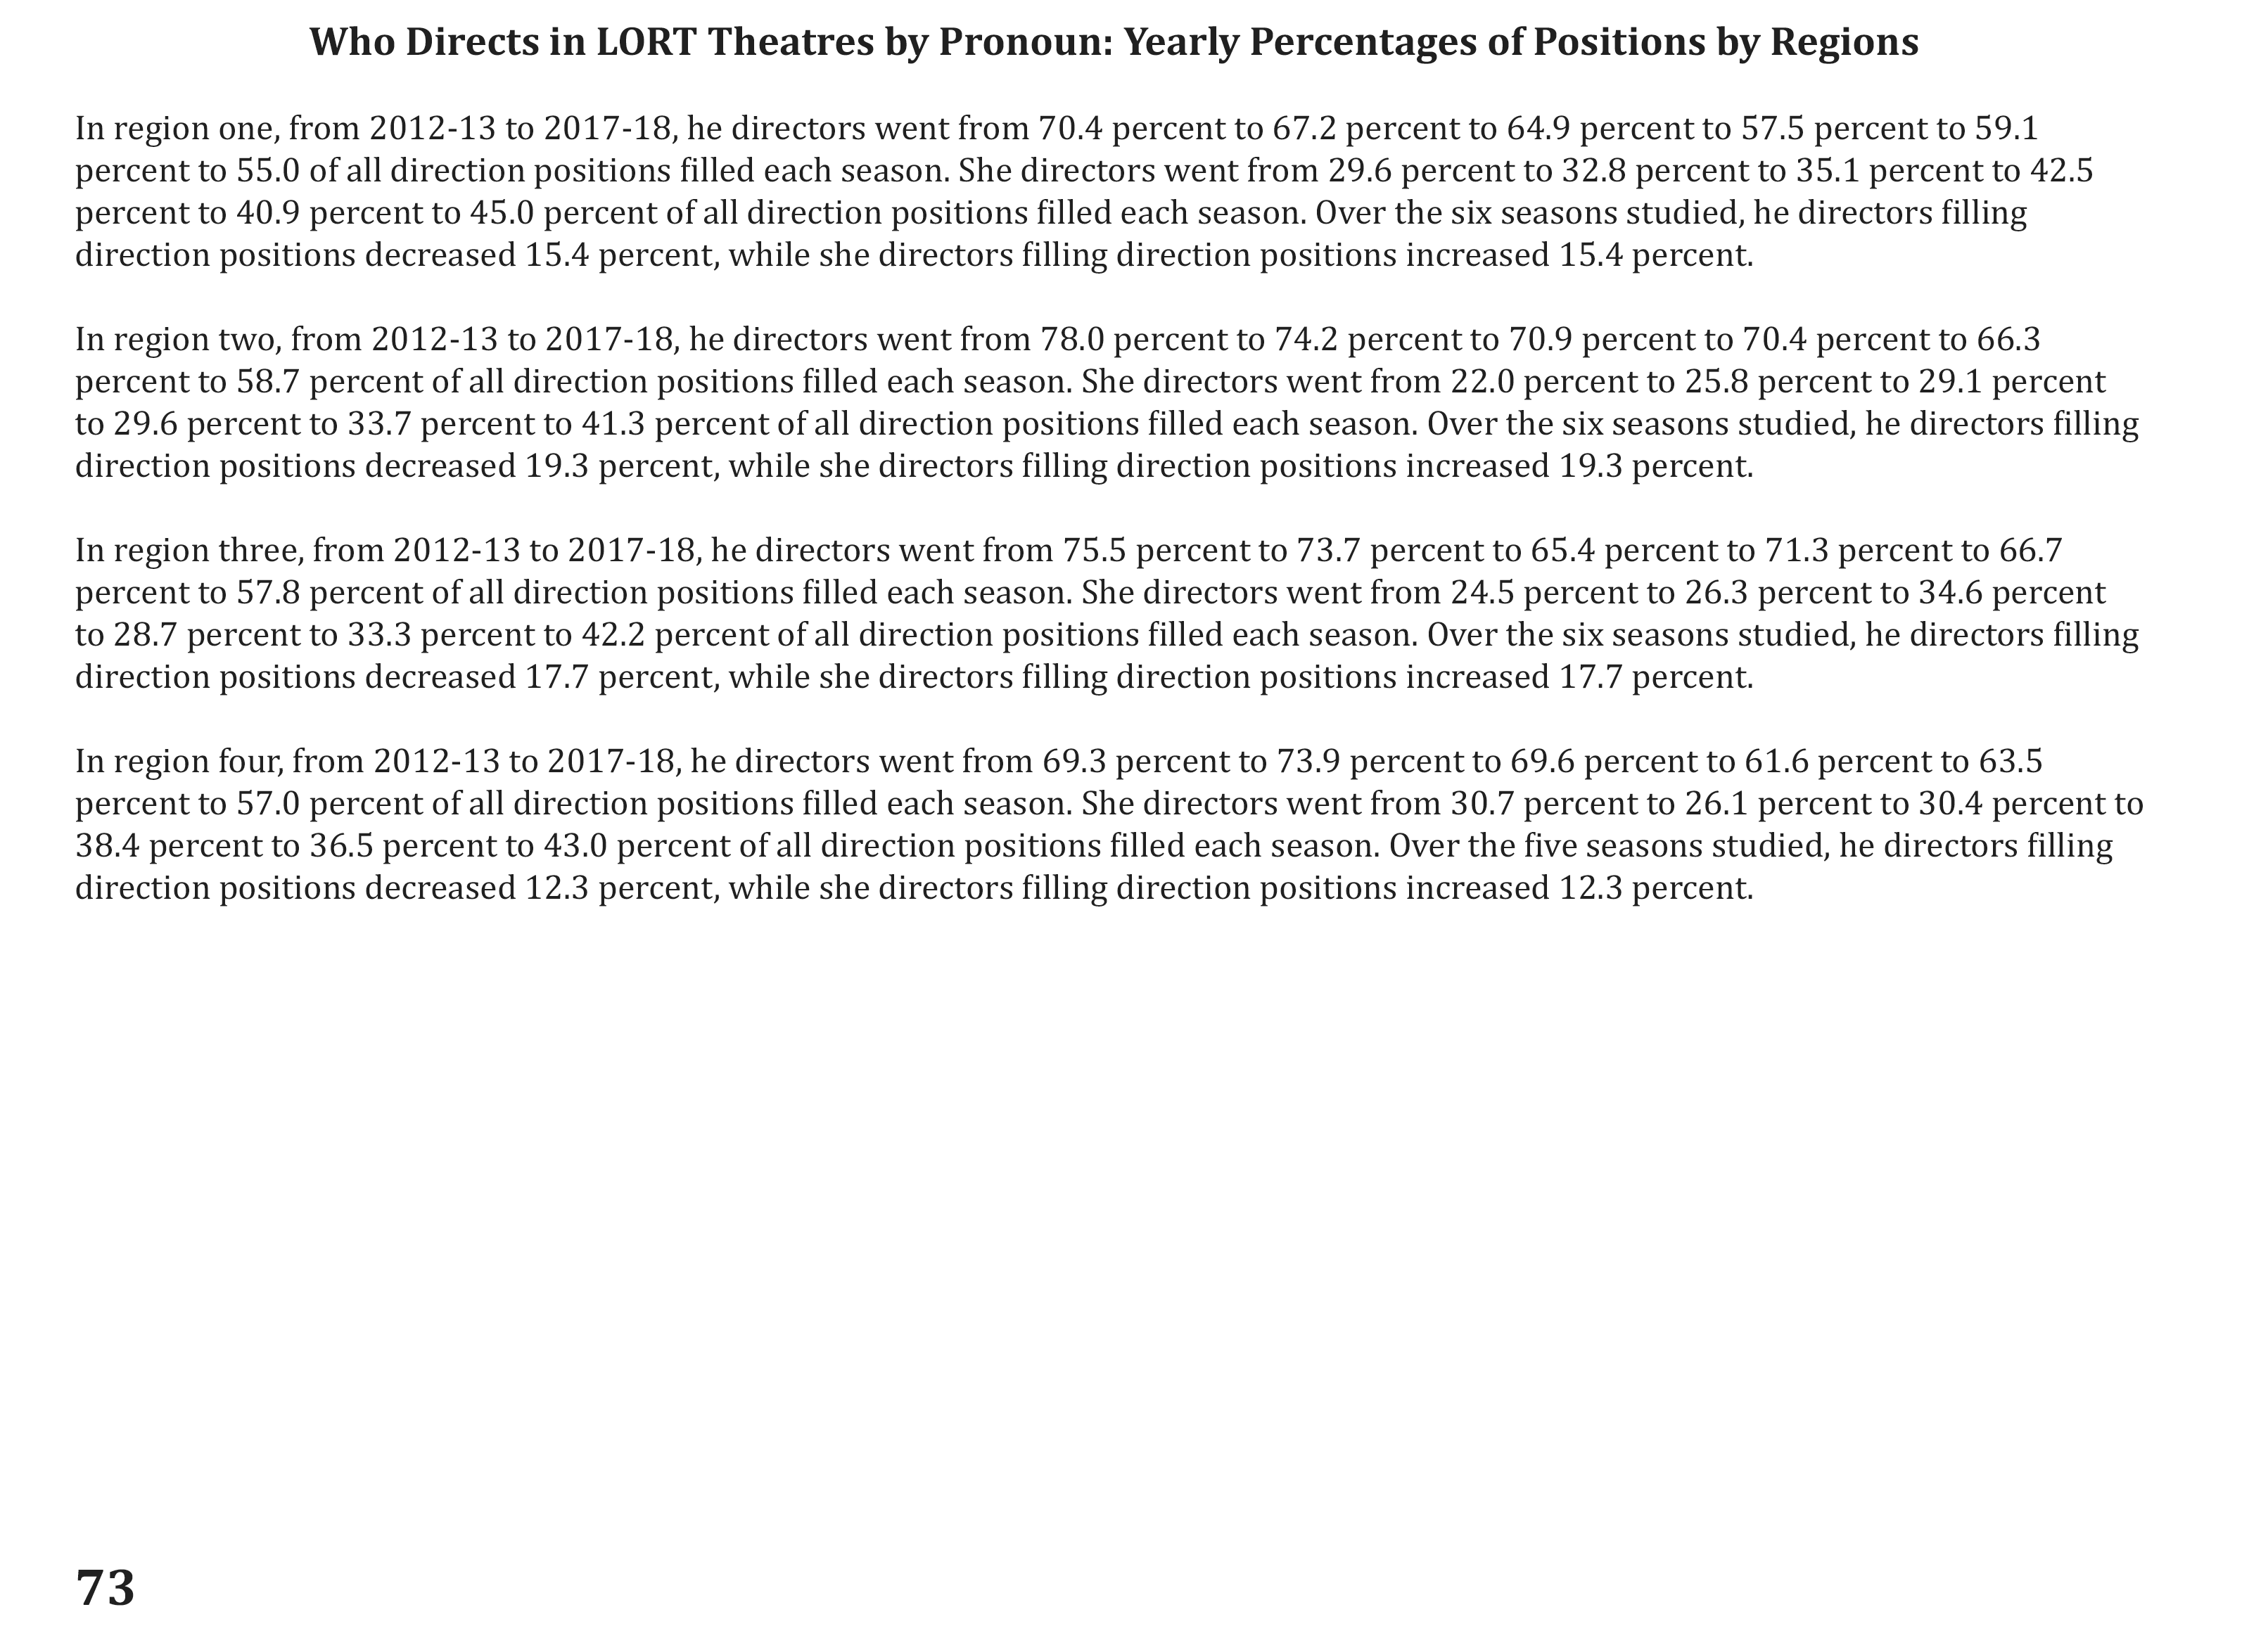
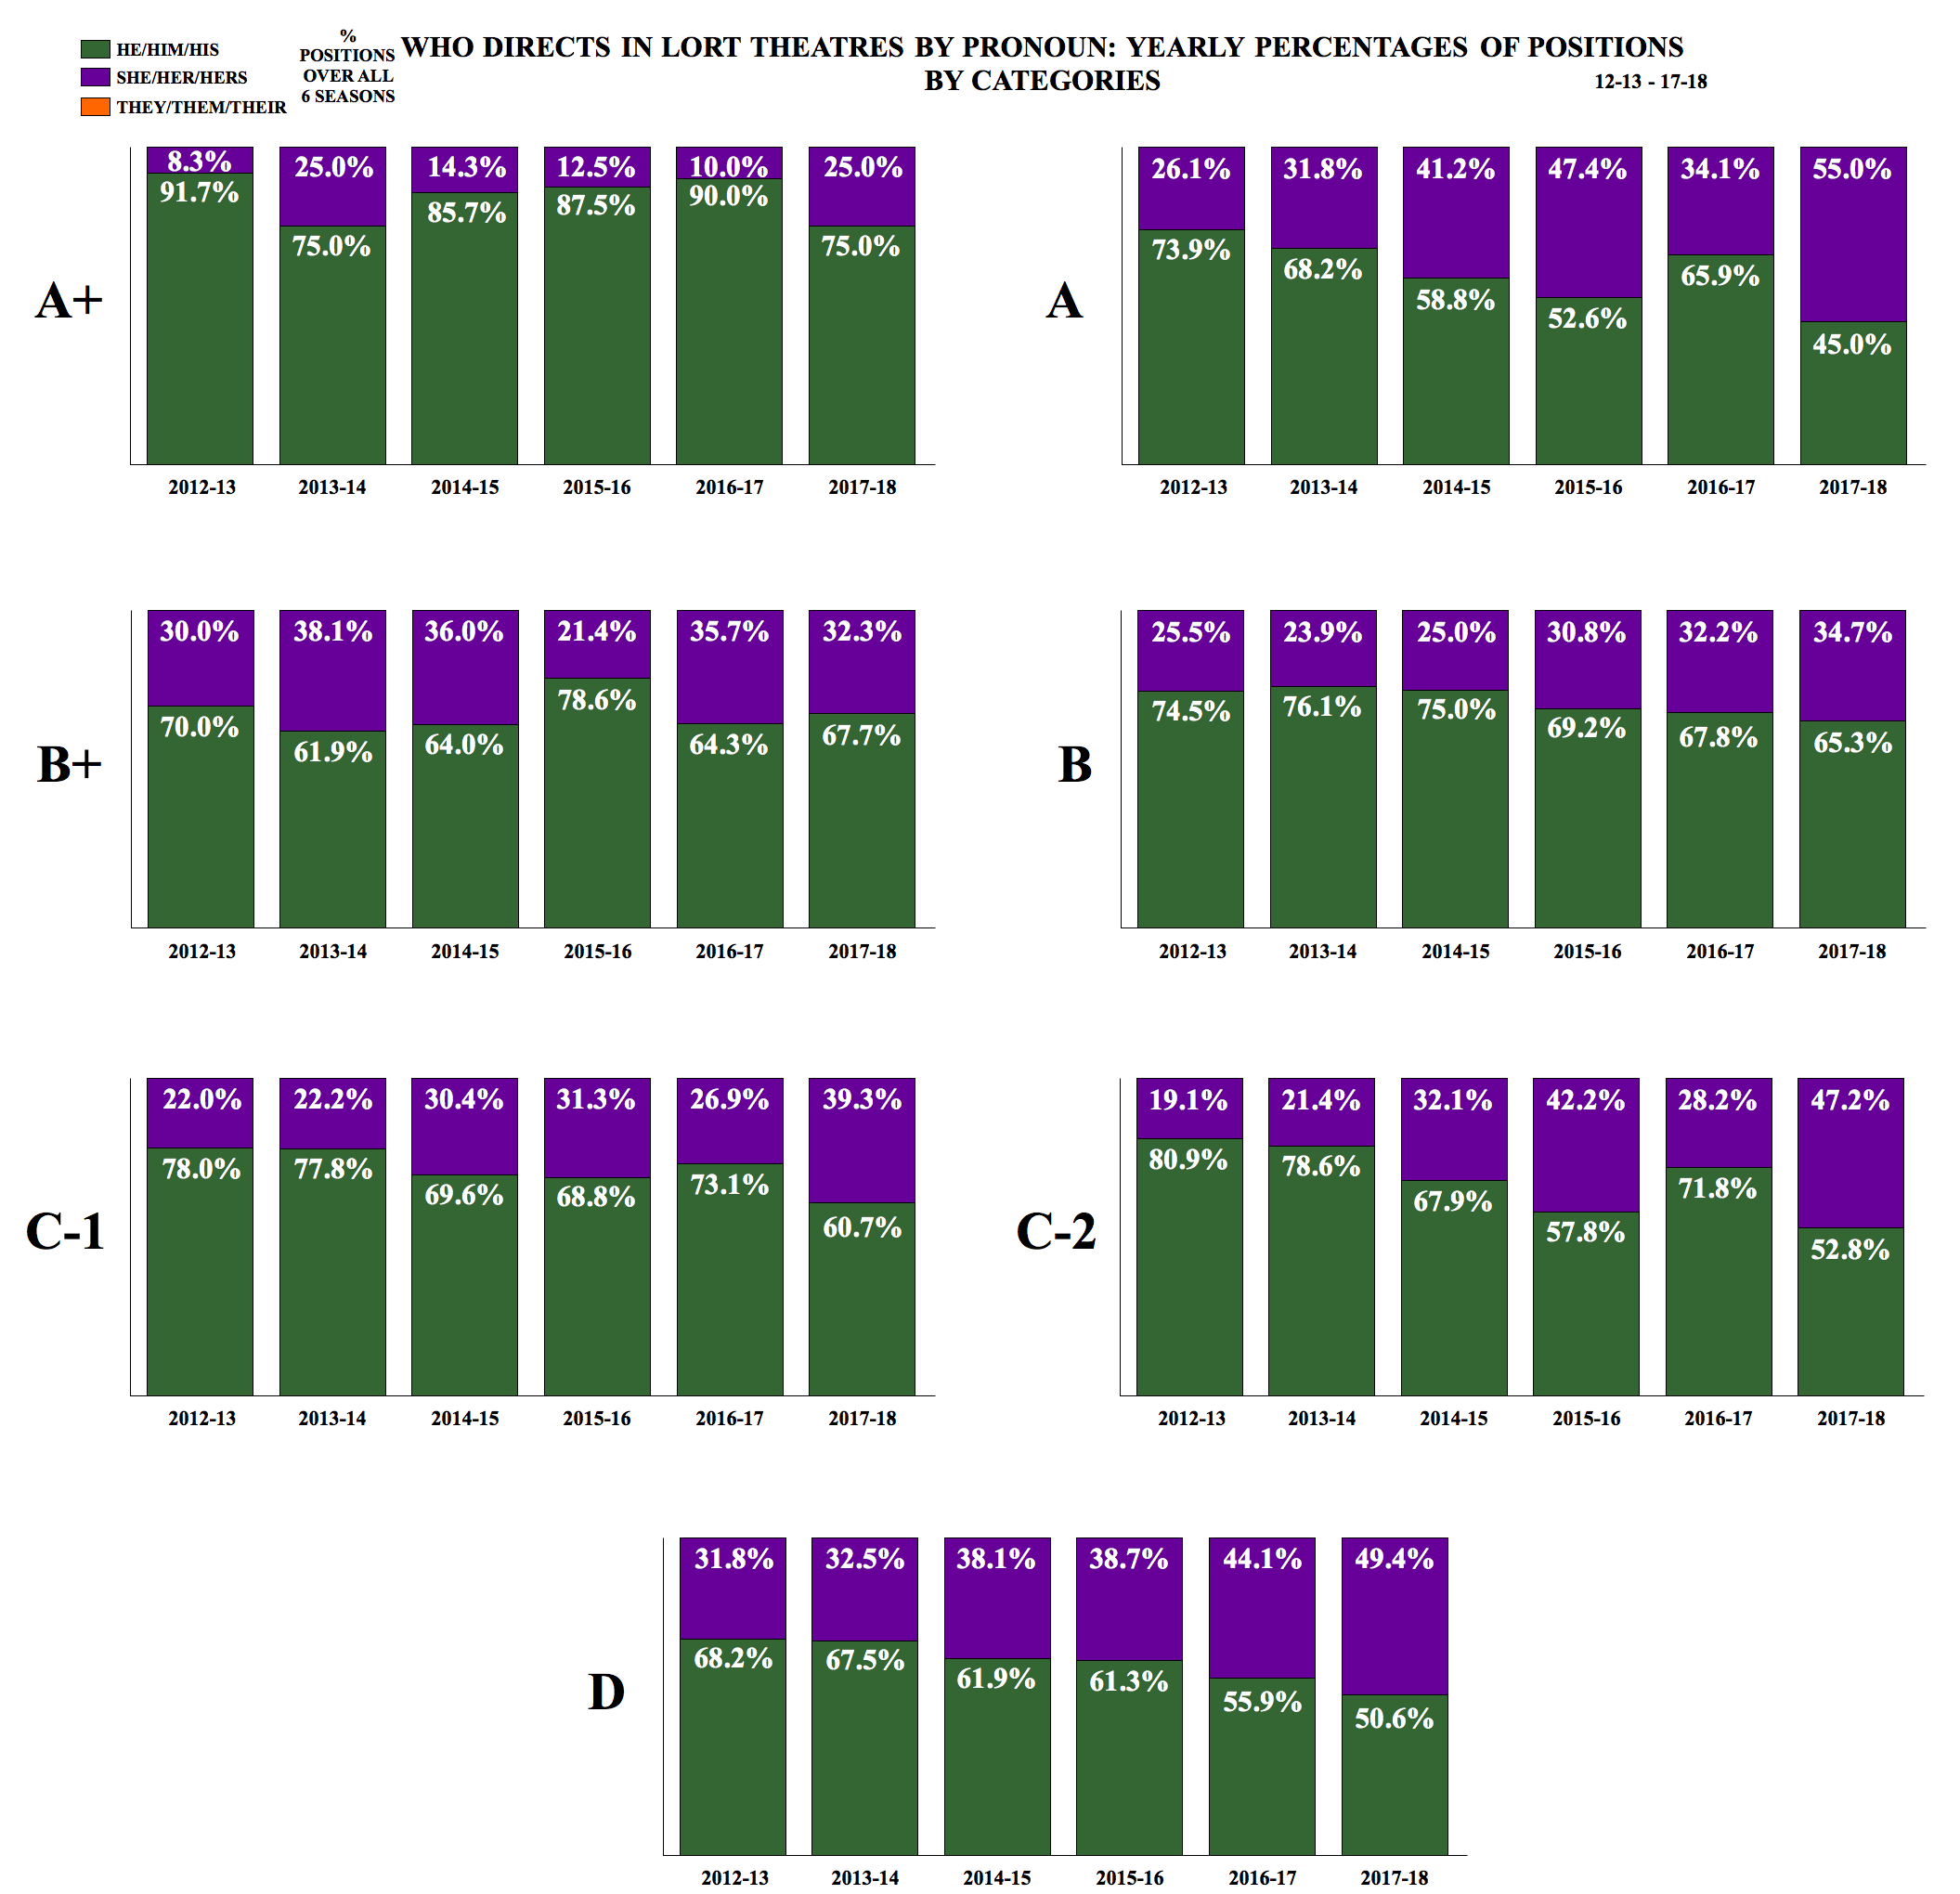
Directors are getting closer faster to gender parity. The percentage of she directors increased by 16.0 percent over the six seasons to 43.1 percent total in the 17-18 and 2018 season. As categories (and thus direction minimums) get higher, the percentage positions filled by she directors goes down. From the A+ category to the D category, the percentages of she directors in direction positions more than doubles. A caveat—there are more than twenty-four times more direction positions filled in D spaces than in A+ spaces.
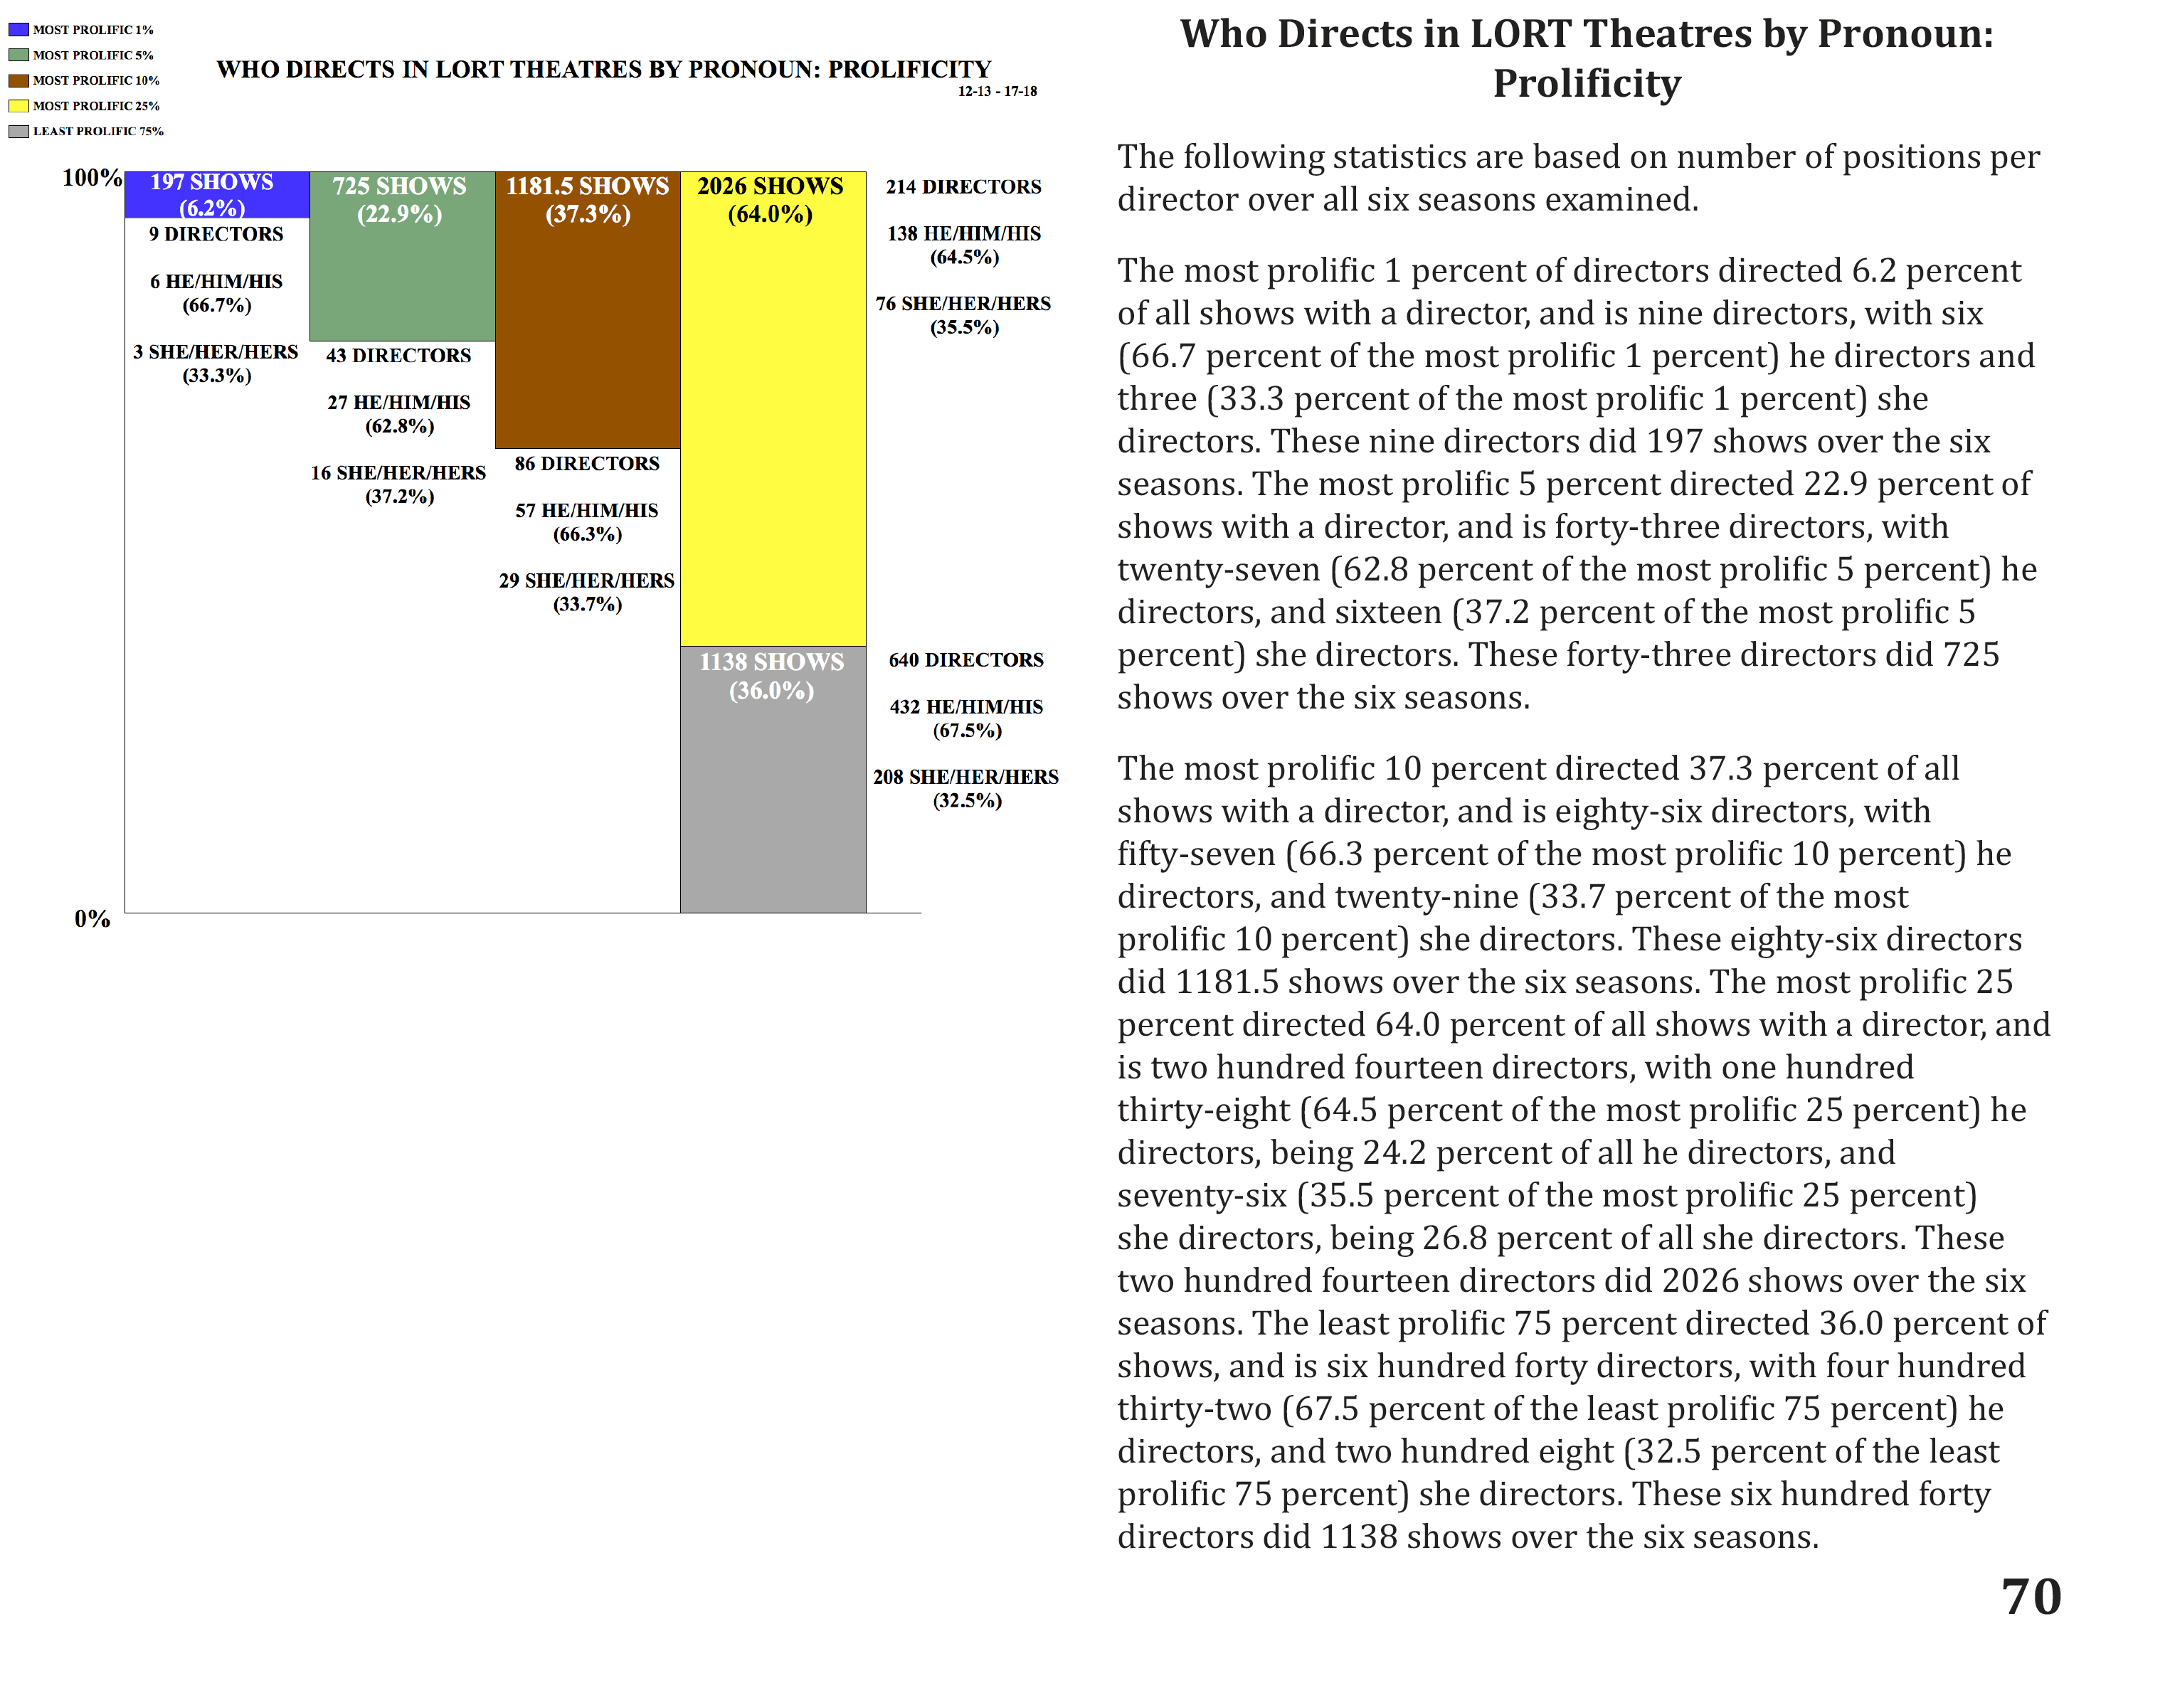
The most prolific 1 percent of directors worked 6.2 percent of all positions available. 197 positions were held by nine directors total, including six he directors and three she directors. That’s an average of 21.9 shows over the six seasons, or between three and four shows a season.
So what’s the bad news?
Over all the seasons I’ve studied (four hundred thirty-four production seasons at seventy-six theatres), 25.1 percent had no she scenic designers. 15.2 percent had no he costume designers, and 32.9 percent had no she lighting designers. There were no she sound designers in 56.5 percent of those seasons. Over half! Looking at each of the seventy-six theatres, 5.3 percent had no she lighting designers and 10.5 percent had no she sound designers in any of the seasons studied.
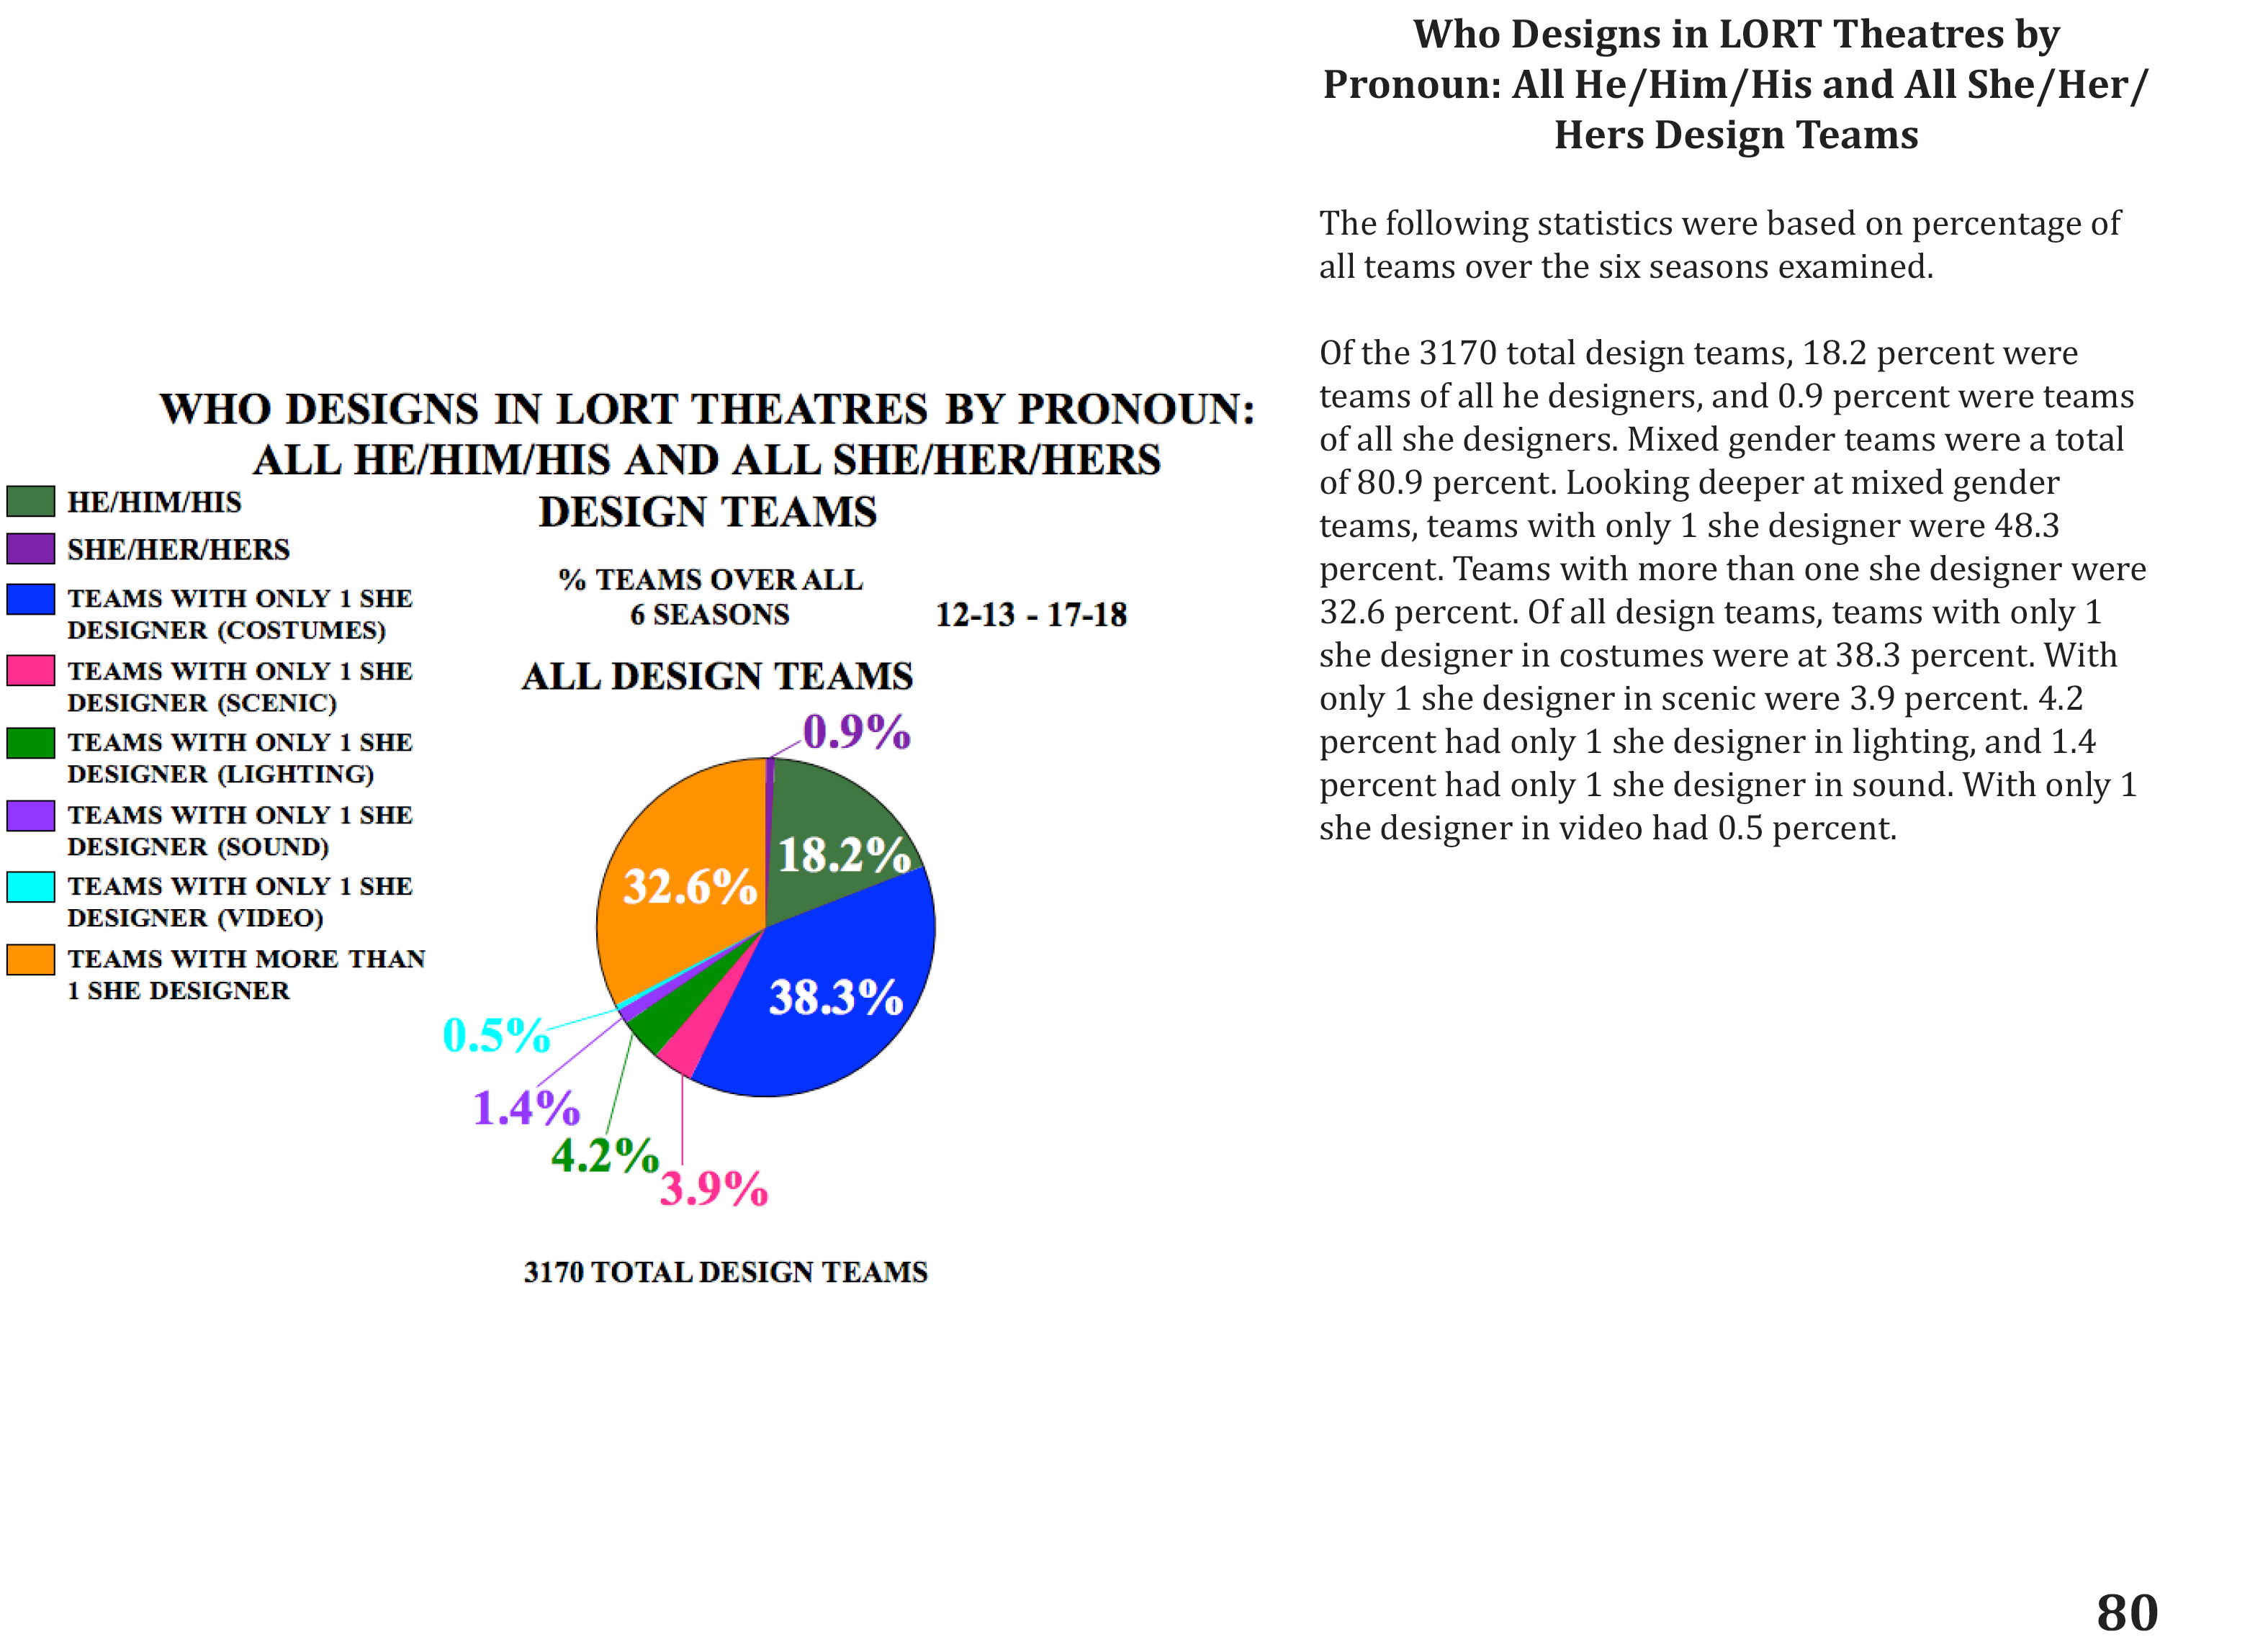
How do design teams break down between he and she designers?
Over all six seasons studied, 0.9 percent of the shows had all she teams and 18.2 percent had all he teams. 32.6 percent had more than one she designer on the team. 48.3 percent had one she designer on the team, breaking down as follows:
- 38.3 percent had one she designer in costume design
- 3.9 percent had one she designer in scenic design, and 4.2 percent had one she designer in lighting design.
- 1.4 percent had one she designer in sound design, and 0.5 percent had one she designer in projection/video design.
Correlations
Looking at all six seasons, when there’s a she director on a show, there’s a 6.0 percent increase in she designers overall compared to when there’s a he director. When there’s a she artistic director, she directors hold 48.5 percent of the direction positions. But when the artistic director herself is excluded, that percentage drops to 35.3 percent she directors. When there’s a he artistic director, she directors hold 30.4 percent of the direction positions. But when the artistic director himself is excluded, that percentage increased to 38.5 percent she directors.
Look at who you’re currently hiring and have hired in the past. What story are those choices telling?
How We Move Forward
When I look over the six years of data and all the charts, I have a few strong opinions I want to share. Yes, we need to work to make the pipeline wider and more accessible to more people. But designers and directors who are from underrepresented and marginalized communities are already working as professionals. They exist now. In a system where networking and recommendations are a primary way of getting jobs, people with the most privilege tend to get more work.
There are many ways to disrupt this dynamic, and in my opinion, here is the main one: actively look for designers and directors, rather than just hiring the people you already know. Maybe even post a call for resumes with pay range clearly stated. Make the time to actually interview people, instead of only considering a resume and portfolio. Make it a priority to hire new-to-your-theatre designers. Hire more women designers. Hire more designers of color. Hire more non-binary designers. Hire more disabled designers. Hire more designers from underrepresented and marginalized communities and identities.
Don’t expect people to find you—do the work to find them. Look at who you’re currently hiring and have hired in the past. What story are those choices telling? (And if you’re not doing the hiring, what story do you tell with wherever you have agency?) Is it the story you want to tell? It’s hard work, American theatre, but despite everything, all the evidence to the contrary, I still believe you can and will do what is vital to meet your stated values of equity, inclusion, diversity, justice, and access.
Changes and Rationale
I changed the title from the last three years. Given the continually evolving conversation about the complexity of gender identity, and using pronouns to clarify the data, it just made sense to change the title from “by gender” to “by pronoun.” I also eliminated the phase number to designate each year because I’ve changed my thinking about how to approach the study. When I came up with phase, I was thinking I would find the precise number of charts to examine the data. After all, I started with just one chart. Then there were eleven charts, then twelve, and last year, there were forty-one charts. I realize now that I’m continually learning, so I just keep adding more charts, so the year designation is clearer.
I believe race, disability, and most aspects of social identity have to be self-identified. As this study relies on public biographies to make pronoun determination, I don’t see a path forward for me to measure any additional facets of identity beyond my current scope, given my own limits and the difficulty in obtaining self-identified data. It’s one of the major limitations of this study and I apologize for any harm this singular focus causes.
The fifth year of this study adds a few additional ways of looking at the data to more fully explore the gender statistics of designers, directors, and artistic directors working at LORT member theatres. To begin, I added the 2017-18 and 2018 production seasons (some theatres’ seasons spanned 2017-18, while others were all in the 2018 calendar year) to the overall data. I changed the look of the prolificity graphs for easier reading. Please note that some of the yearly percentages are based on very small numbers of positions, particularly in the projection/video design discipline and the A+ and A categories. I examined teams with only one she designer, and how they correlate with gender identity of the director and artistic director. I also looked at yearly percentages of design team breakdowns.
How I Do This Study
I collected data primarily from the theatres’ own websites, TCG Member Profiles, BroadwayWorld.com, Playbill.com, and various newspaper and internet review sites. Then I wrote the theatres directly with the data I collected, and asked for confirmation and/or correction. I excluded the following: tours, events, galas, Theatre for Young Audiences shows, and any production that was presented rather than produced.
In cases where theatres run their seasons yearly, the 2013 season was combined with the 2012-13 season for statistical purposes, and so forth. I collected data and then sent what I found to the theatres themselves for confirmation. Only lead designers, no assistants or associates, were counted. In cases where multiple designers worked as co-designers, they each got partial credit. For example, Joe and Jane were the co-scenic designers of a production, so they each received 0.5 in the designer counting. People were counted as individual designers in each discipline, even if they designed in two or more disciplines. And of course, as always, correlation is not causation.
Many designers and directors work both inside LORT member theatres and elsewhere. This study does not suggest that the numbers below reflect the totality of an individual’s work for the six seasons. Although there are some resident designer jobs, the vast majority of design positions do not go to resident designers, and I have not made a distinction between resident and freelance designers in this study.
Of the then seventy-six LORT member theatres, based on prior years’ and this year’s confirmation, 93.7 percent of the 3170 productions were confirmed. All the graphs are based on both confirmed and unconfirmed information. In the case of one theatre, the “head” of the theatre is an executive director rather than an artistic director, so that’s the information I used for the statistics. In the case of another theatre, the “head” of the theatre is titled as the theatre’s director rather than as an artistic director, so again that’s the information I used for the statistics. I rounded to one decimal point, which resulted in some graphs not equaling 100 percent exactly. As theatres confirm past seasons’ information each year, some statistics may be different than the ones from last year
If you work at one of these theatres and would like your company’s specific raw data, please write me at [email protected] from your institutional email, and I’ll happily send it to you. Please allow a week for a response. If you work at a LORT theatre and would like to confirm data in the future, please send me an email from your institutional email.
Who Designs in LORT Theatres by Pronoun:
Positions & People

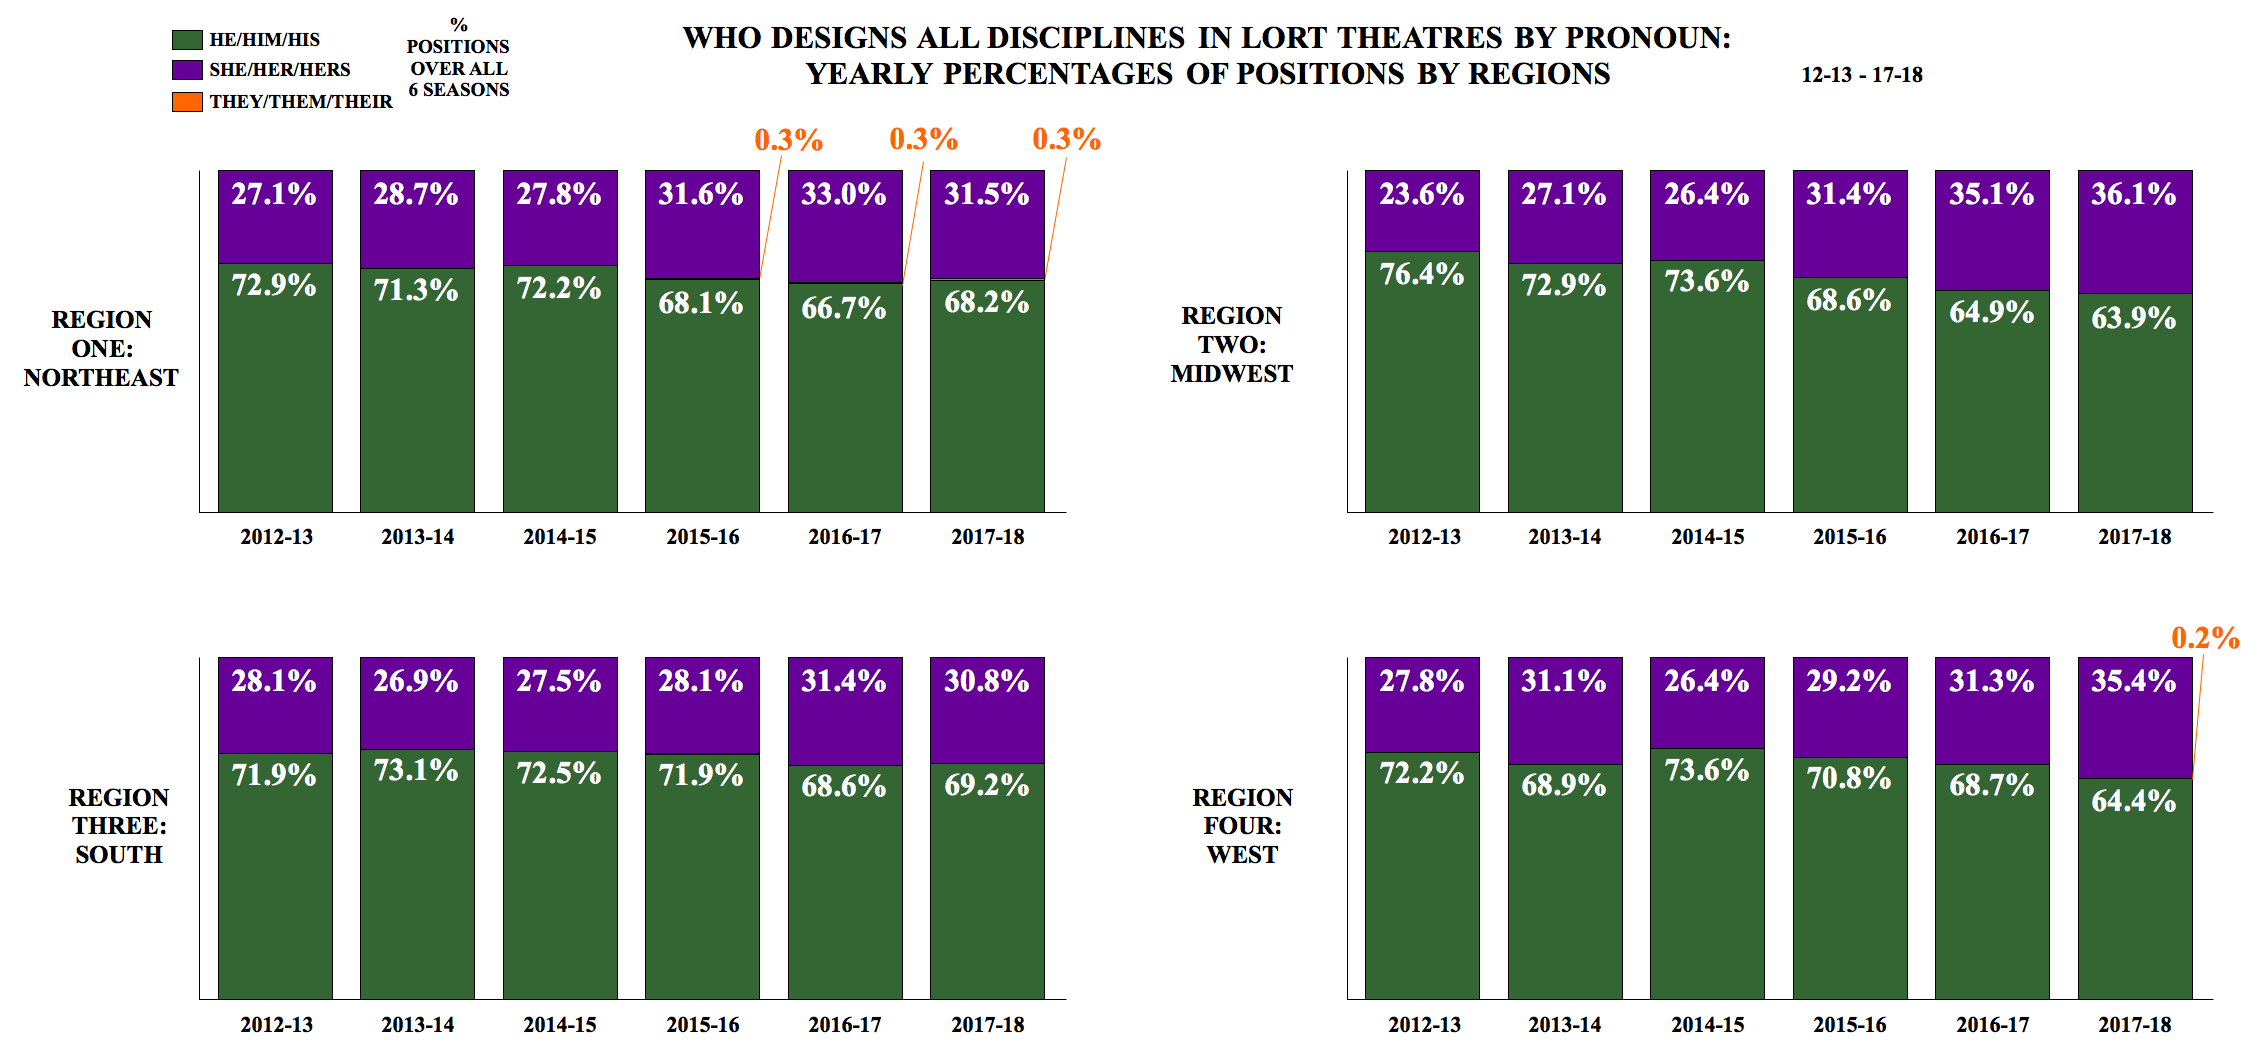
Averages

Yearly Percentages of Positions


Categories


Who Directs in LORT Theatres by Pronoun:
Positions, People, & Averages

Prolificity

Regions & Categories, Yearly Percentages by Positions

Yearly Percentages of Positions by Regions

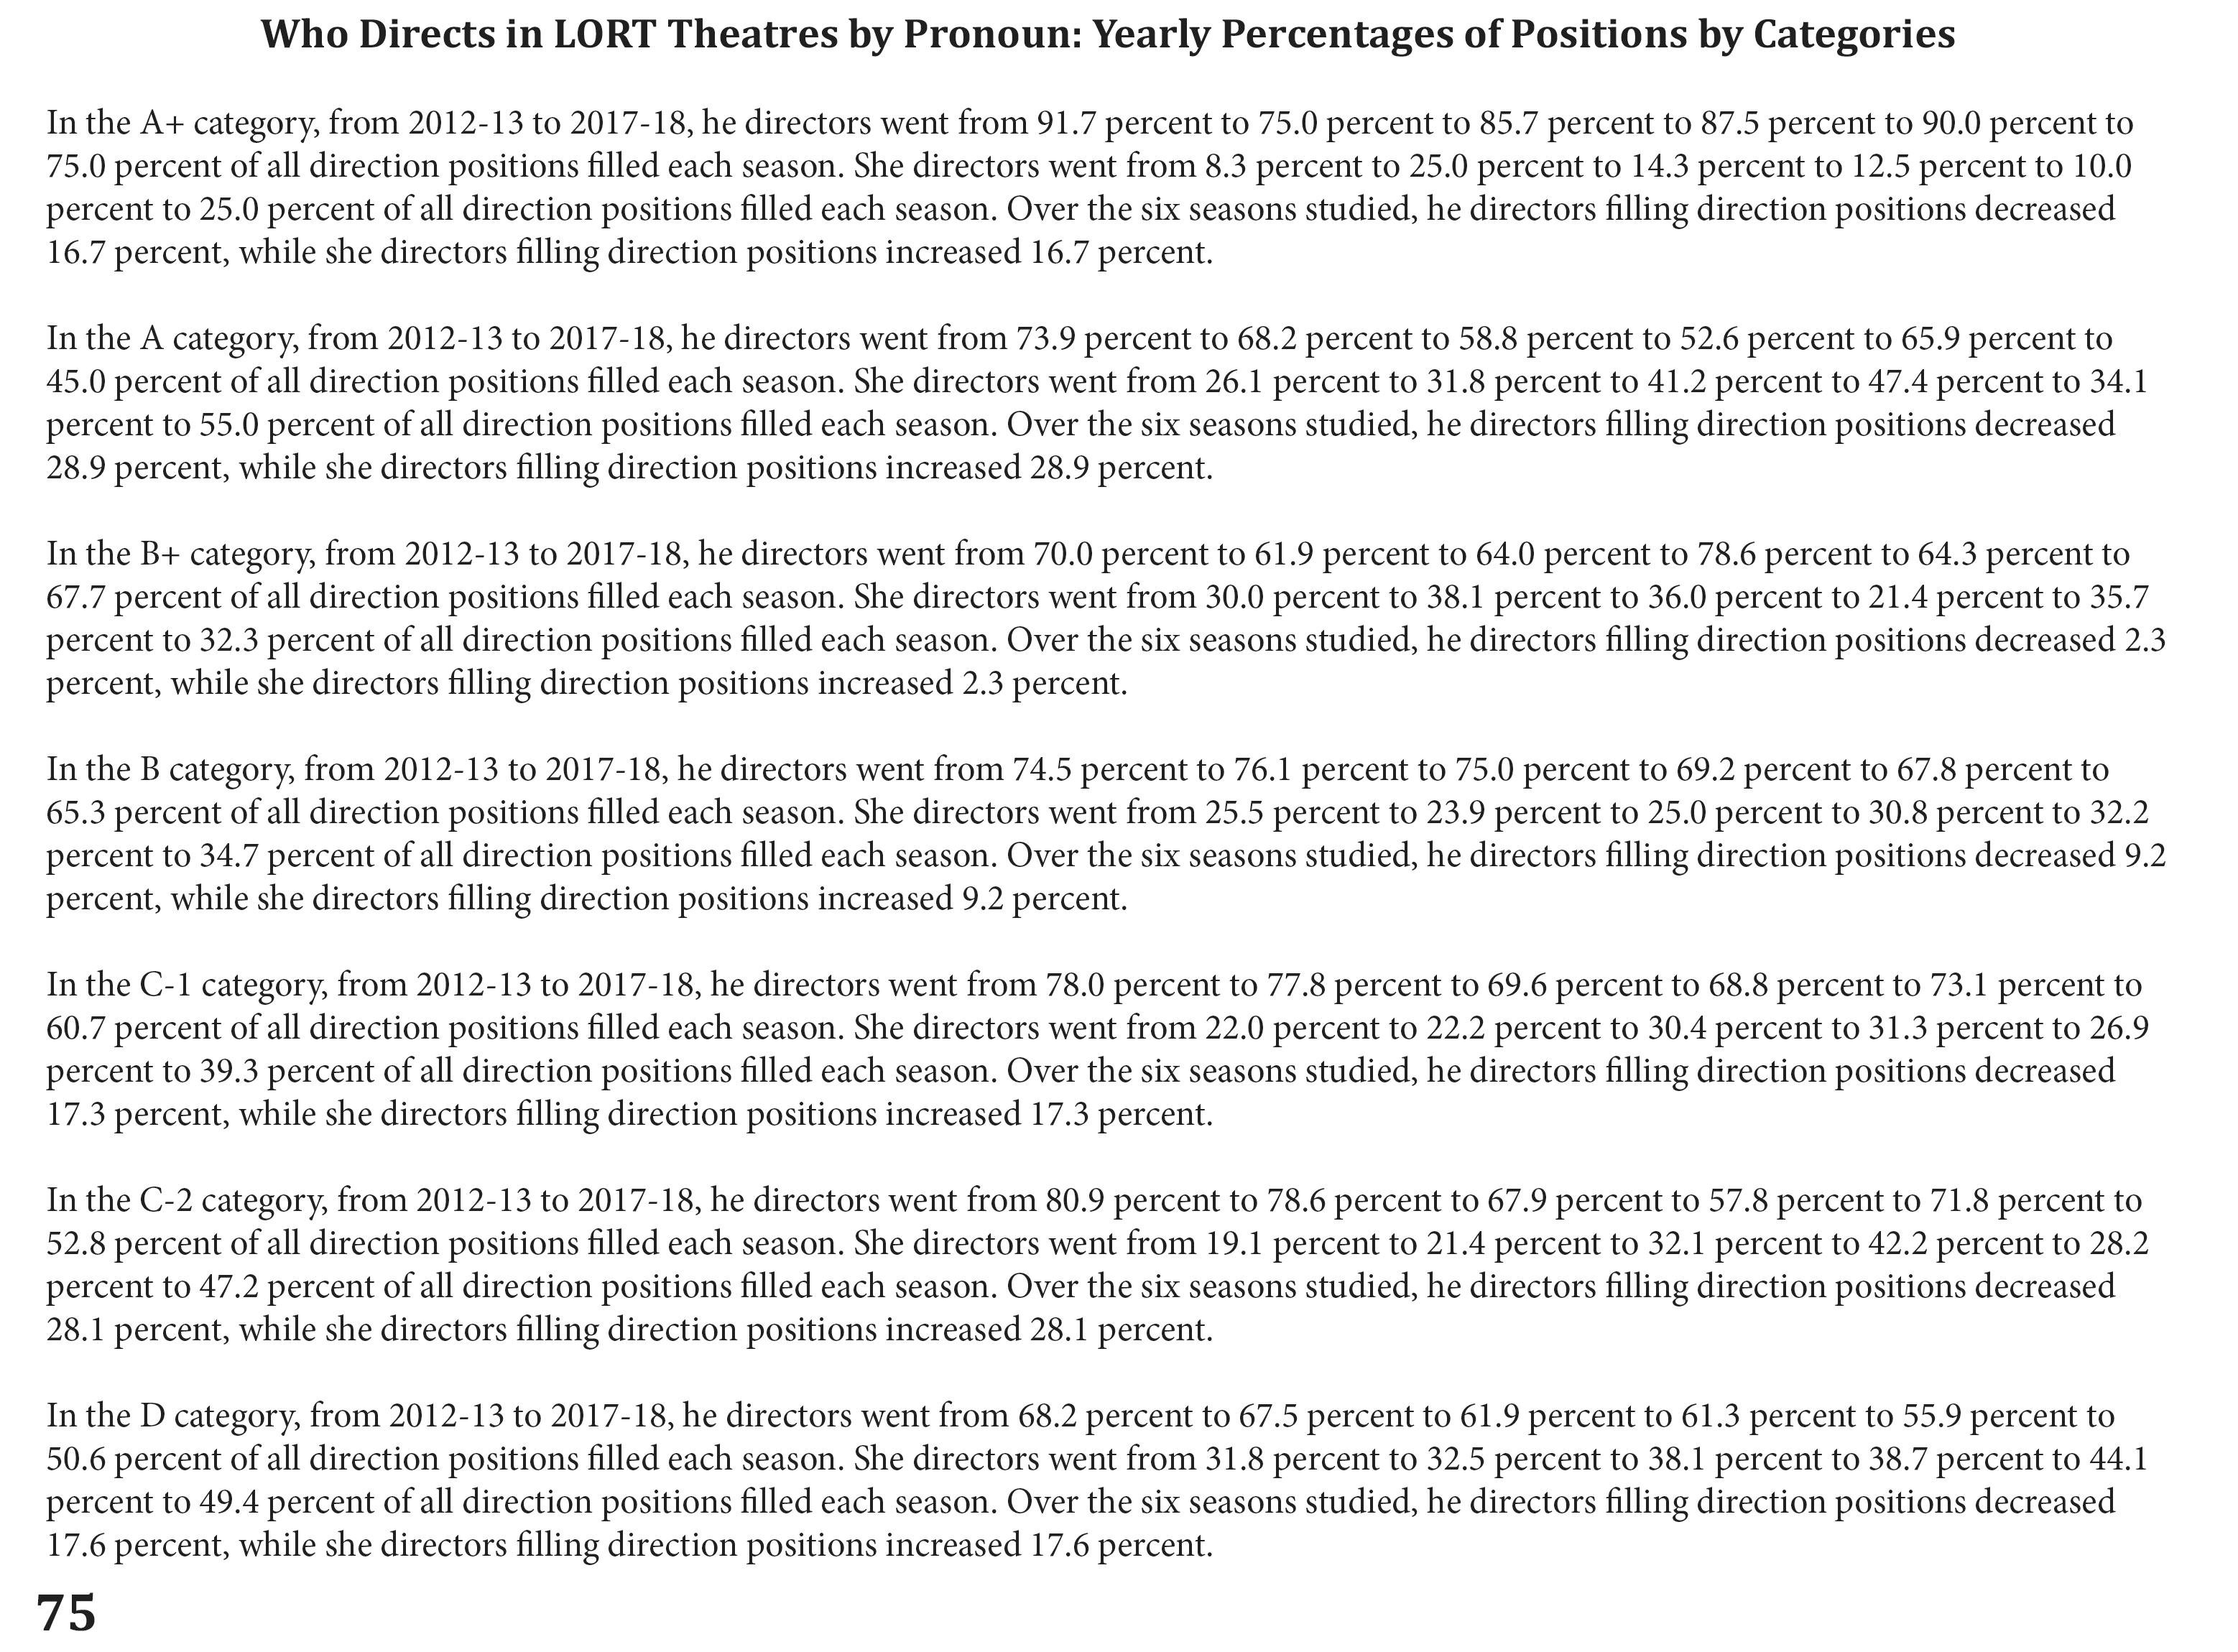
Yearly Percentages of Positions by Categories

Artistic Directors:
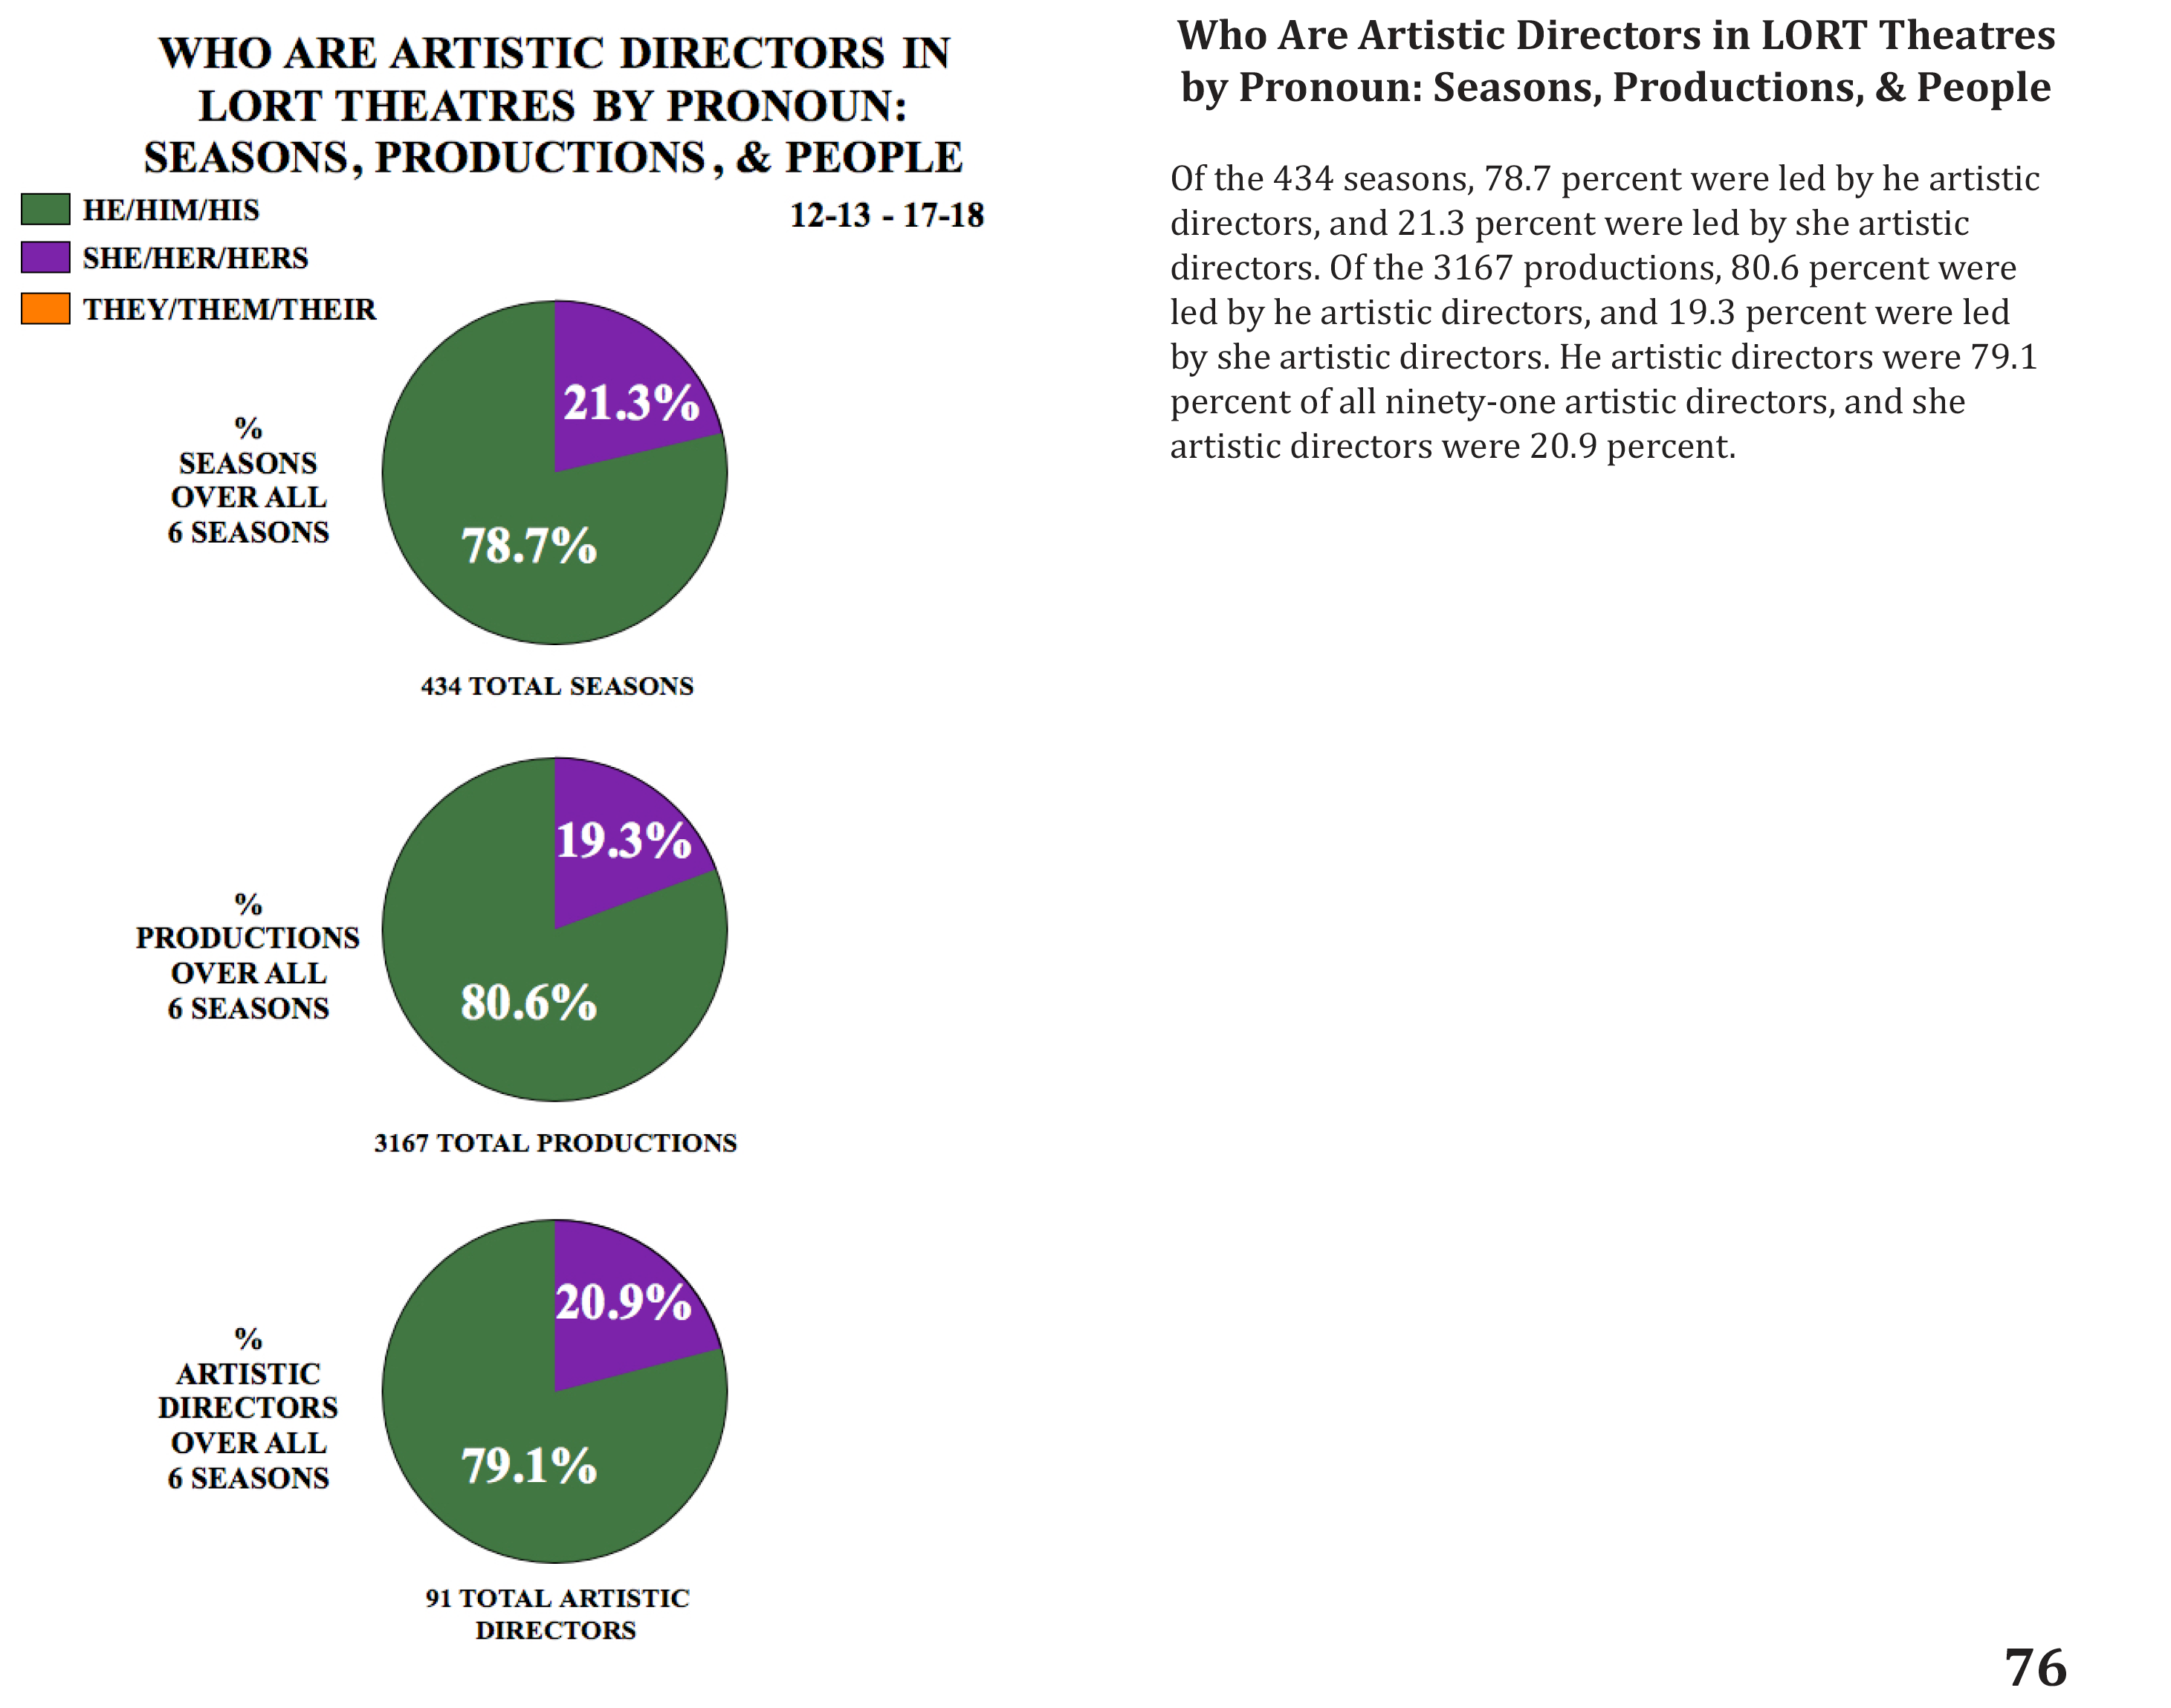
Seasons, Productions, and People

Correlations between Artistic Director and Director

Correlations between Artistic Director and Designers

Correlations between Director and Designers

All He/Him/His and All She/Her/Hers Design Teams

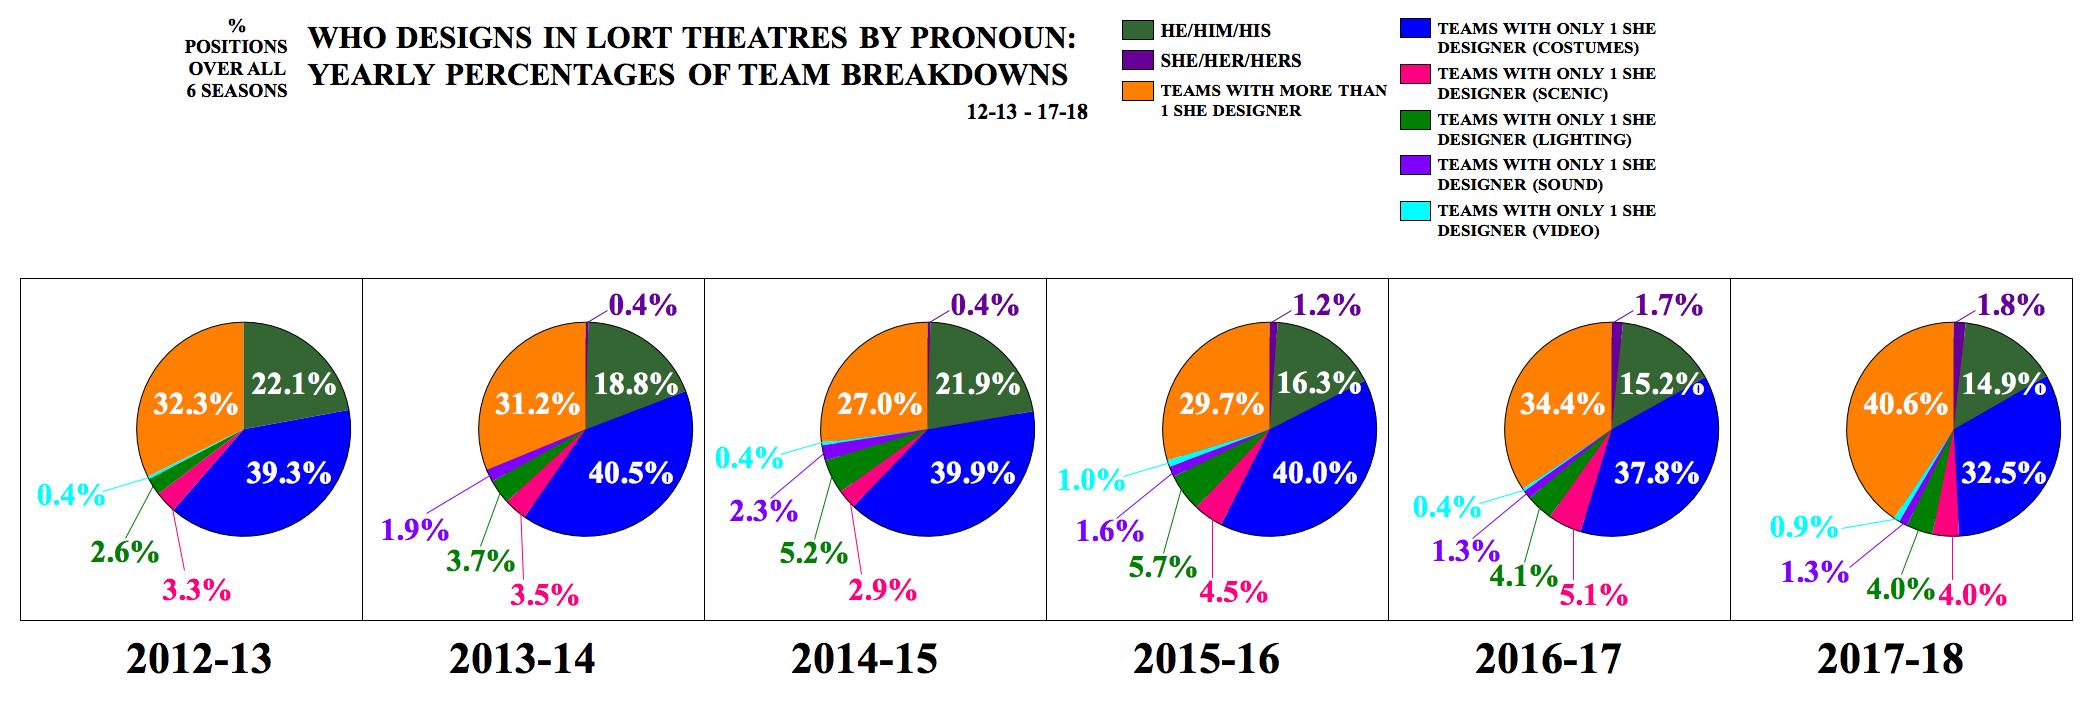
Yearly Percentages of Team Breakdowns

Correlations between All He/Him/His and All She/Her/Hers Design Teams and Artistic Director

Correlations between All He/Him/His and All She/Her/Hers Design Teams and Director

Individual Theatre Seasons and Theatres Without

Single Stage and Multiple Stage Theatres


Thank You
Thank you to all my confirmers and to HowlRound for continuing to support this work. I started a Patreon this year to help me keep the study going and more sustainable. Thank you to my Patreon supporters (current as of 1 December 2019): Johanna Pan, Sherrice Marie Mojgani, Adam Salberg, Paula Clarkson, Dante Olivia Smith, Angela Marshall, Nadine Grant Daley, Jennifer McMenemy, Shawna Cadence, Josh Samuels, Jen Waldman, Valérie Thérèse Bart, Travis Bedard, Sara Brookner, Peter J. Kuo, Jane Cox, Sarah Krainin, Cary Patrick Martin, Andie Arthur, Masha Tsimring, Donyale Werle, Sophia Skiles, Barbara Samuels, Amy Altadonna, Wu Chen Khoo, Kate Freer, Jennifer Wishcamper, Sarah Biz, Jo Winiarkski, Cat Starmer, Lianne Arnold, Alexey Bulokhov, Miriam Crowe, Kate Stack, Lindsay Jones, Mike Mallinson, Eric Southern, Andrew Hungerford, Jocelyn Prince, John Rooney, Kristen Robinson, Margo Moskowitz, Michael Robertson, Brad Steinmetz, Mark Barton, Gina Pulice, Women’s Theatre Festival, Jeanette Yew, Jacqueline Reid, Mary Sader, Hannah Hessel Ratner, Alice Tavener, Kristen van Ginhoven, Aileen Zeigler, Andrew Hunt, Margo Gray. Susan Shay, Rachel Grossman & Colin K. Bills, Claudia Alick, and Rachel Browne. Additional thanks to Cary Gillett, Emily Ehrlich Inget, and Christina Watanabe.


Comments
The article is just the start of the conversation—we want to know what you think about this subject, too! HowlRound is a space for knowledge-sharing, and we welcome spirited, thoughtful, and on-topic dialogue. Find our full comments policy here.
Porsche, thank you for continuing to publish this important study each year! It is an incredibly useful report.
May this post is old one in this year 2020 but might be possible this will gonna help others but i am here to discussing about wikipedia page creation services or anyone of you have more idea about theatres service provider then please mentioned below.