A note before we begin: There’s no elegant and short way yet to say “designers-whose-pronouns-are-‘he’ designers” so for the purposes of this article, I’m going to say “he designers,” “she designers,” “she/they designers,” and “they designers” and will do the same for directors and artistic directors.
Welcome to the sixth year of my study, which looks at who designs and directs in LORT theatres by pronoun. This study encompasses data over seven seasons: from the 2012–13 season up through the 2018–19 season.
My data collection method is simple: I collect the data primarily from the theatres’ own websites, TCG member profiles, broadwayworld.com, playbill.com, and various newspaper and review websites. Then, I write the theatres directly and ask for confirmation and/or correction of the data. I exclude the following productions from my research: tours, events, galas, theatre for young audiences, and any production that was presented rather than produced.
Notes on the Data
In cases where theatres run their seasons by calendar year rather than academic year (eg. from January to December 2013, rather than September 2012 to August 2013), I merge that data with the most recent corresponding academic year (eg. the 2013-only seasons are combined with the 2012–13 seasons). Only lead designers—no assistants or associates—are counted. In cases where multiple designers work as co-designers, they each get partial credit (eg. Joe and Jane are the co-scenic designers of a production, so they each receive 0.5 in the designer count). People are counted as individual designers in each discipline—scenic, costumes, lighting, sound, projection/video—even if they designed in two or more disciplines on the same production.
There are many more non-LORT theatres than there are LORT theatres, and many designers and directors work both inside LORT member theatres and elsewhere. This study does not reflect the totality of an individual’s work over the past seven seasons. Although there are some resident designer jobs, the vast majority of design positions do not go to resident designers, and I have not made a distinction between resident and freelance designers in this study. Also, in one case, the “head” of the theatre is an executive director rather than an artistic director, so that’s the information I used for the statistics.
Stage categories are determined by the LORT-AEA agreement (weekly box office receipts and Tony Award eligibility) and the LORT-SDC agreement (C category divided into two categories by number of seats); more information on minimum rates for designers based on LORT stage categories can be found here.
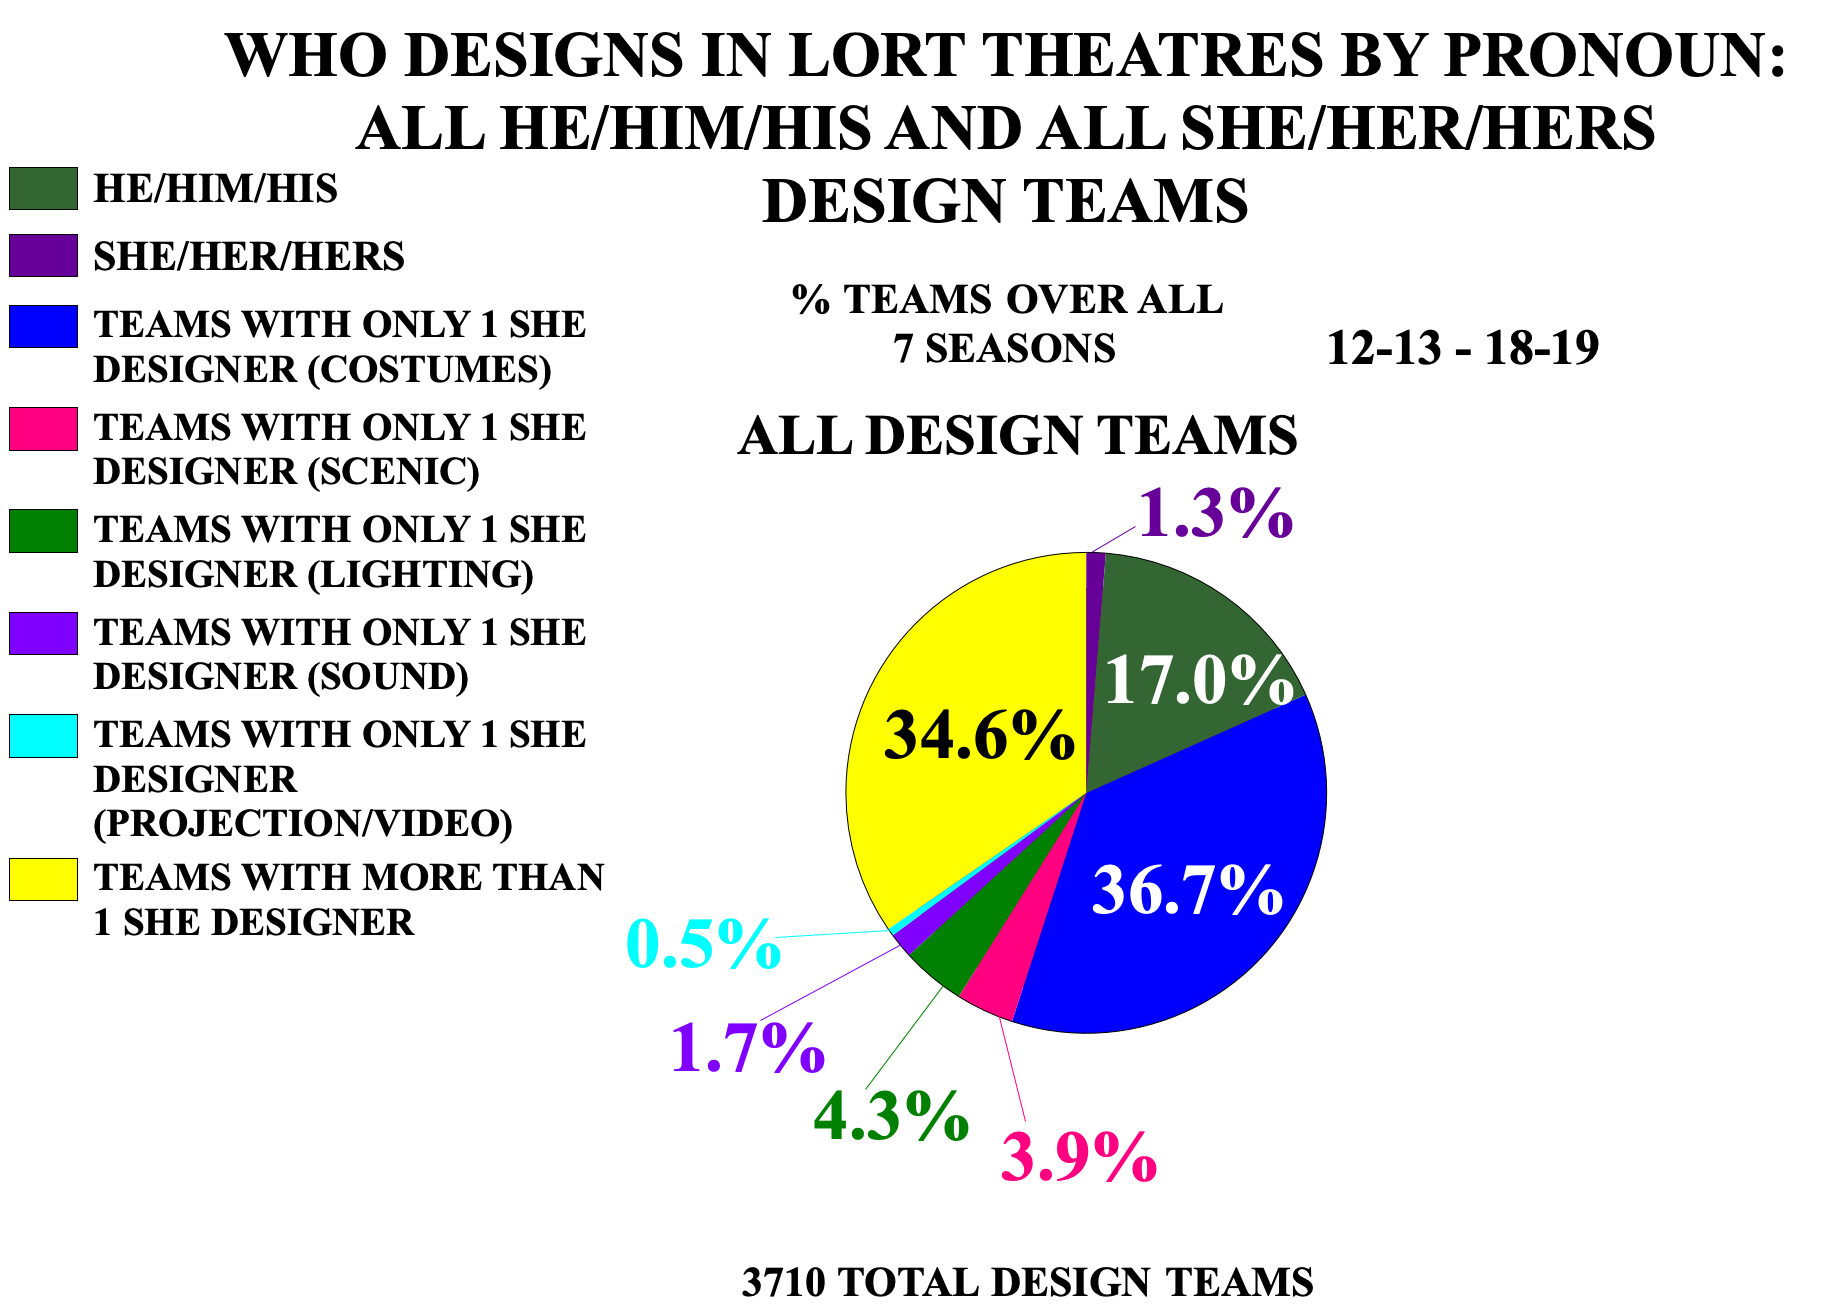
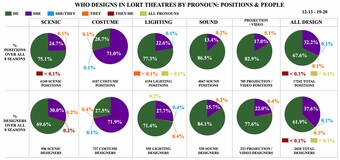
Looking at yearly percentages of design team breakdowns, 2018–19 shows significant increases in the number of teams with more than one she designer.
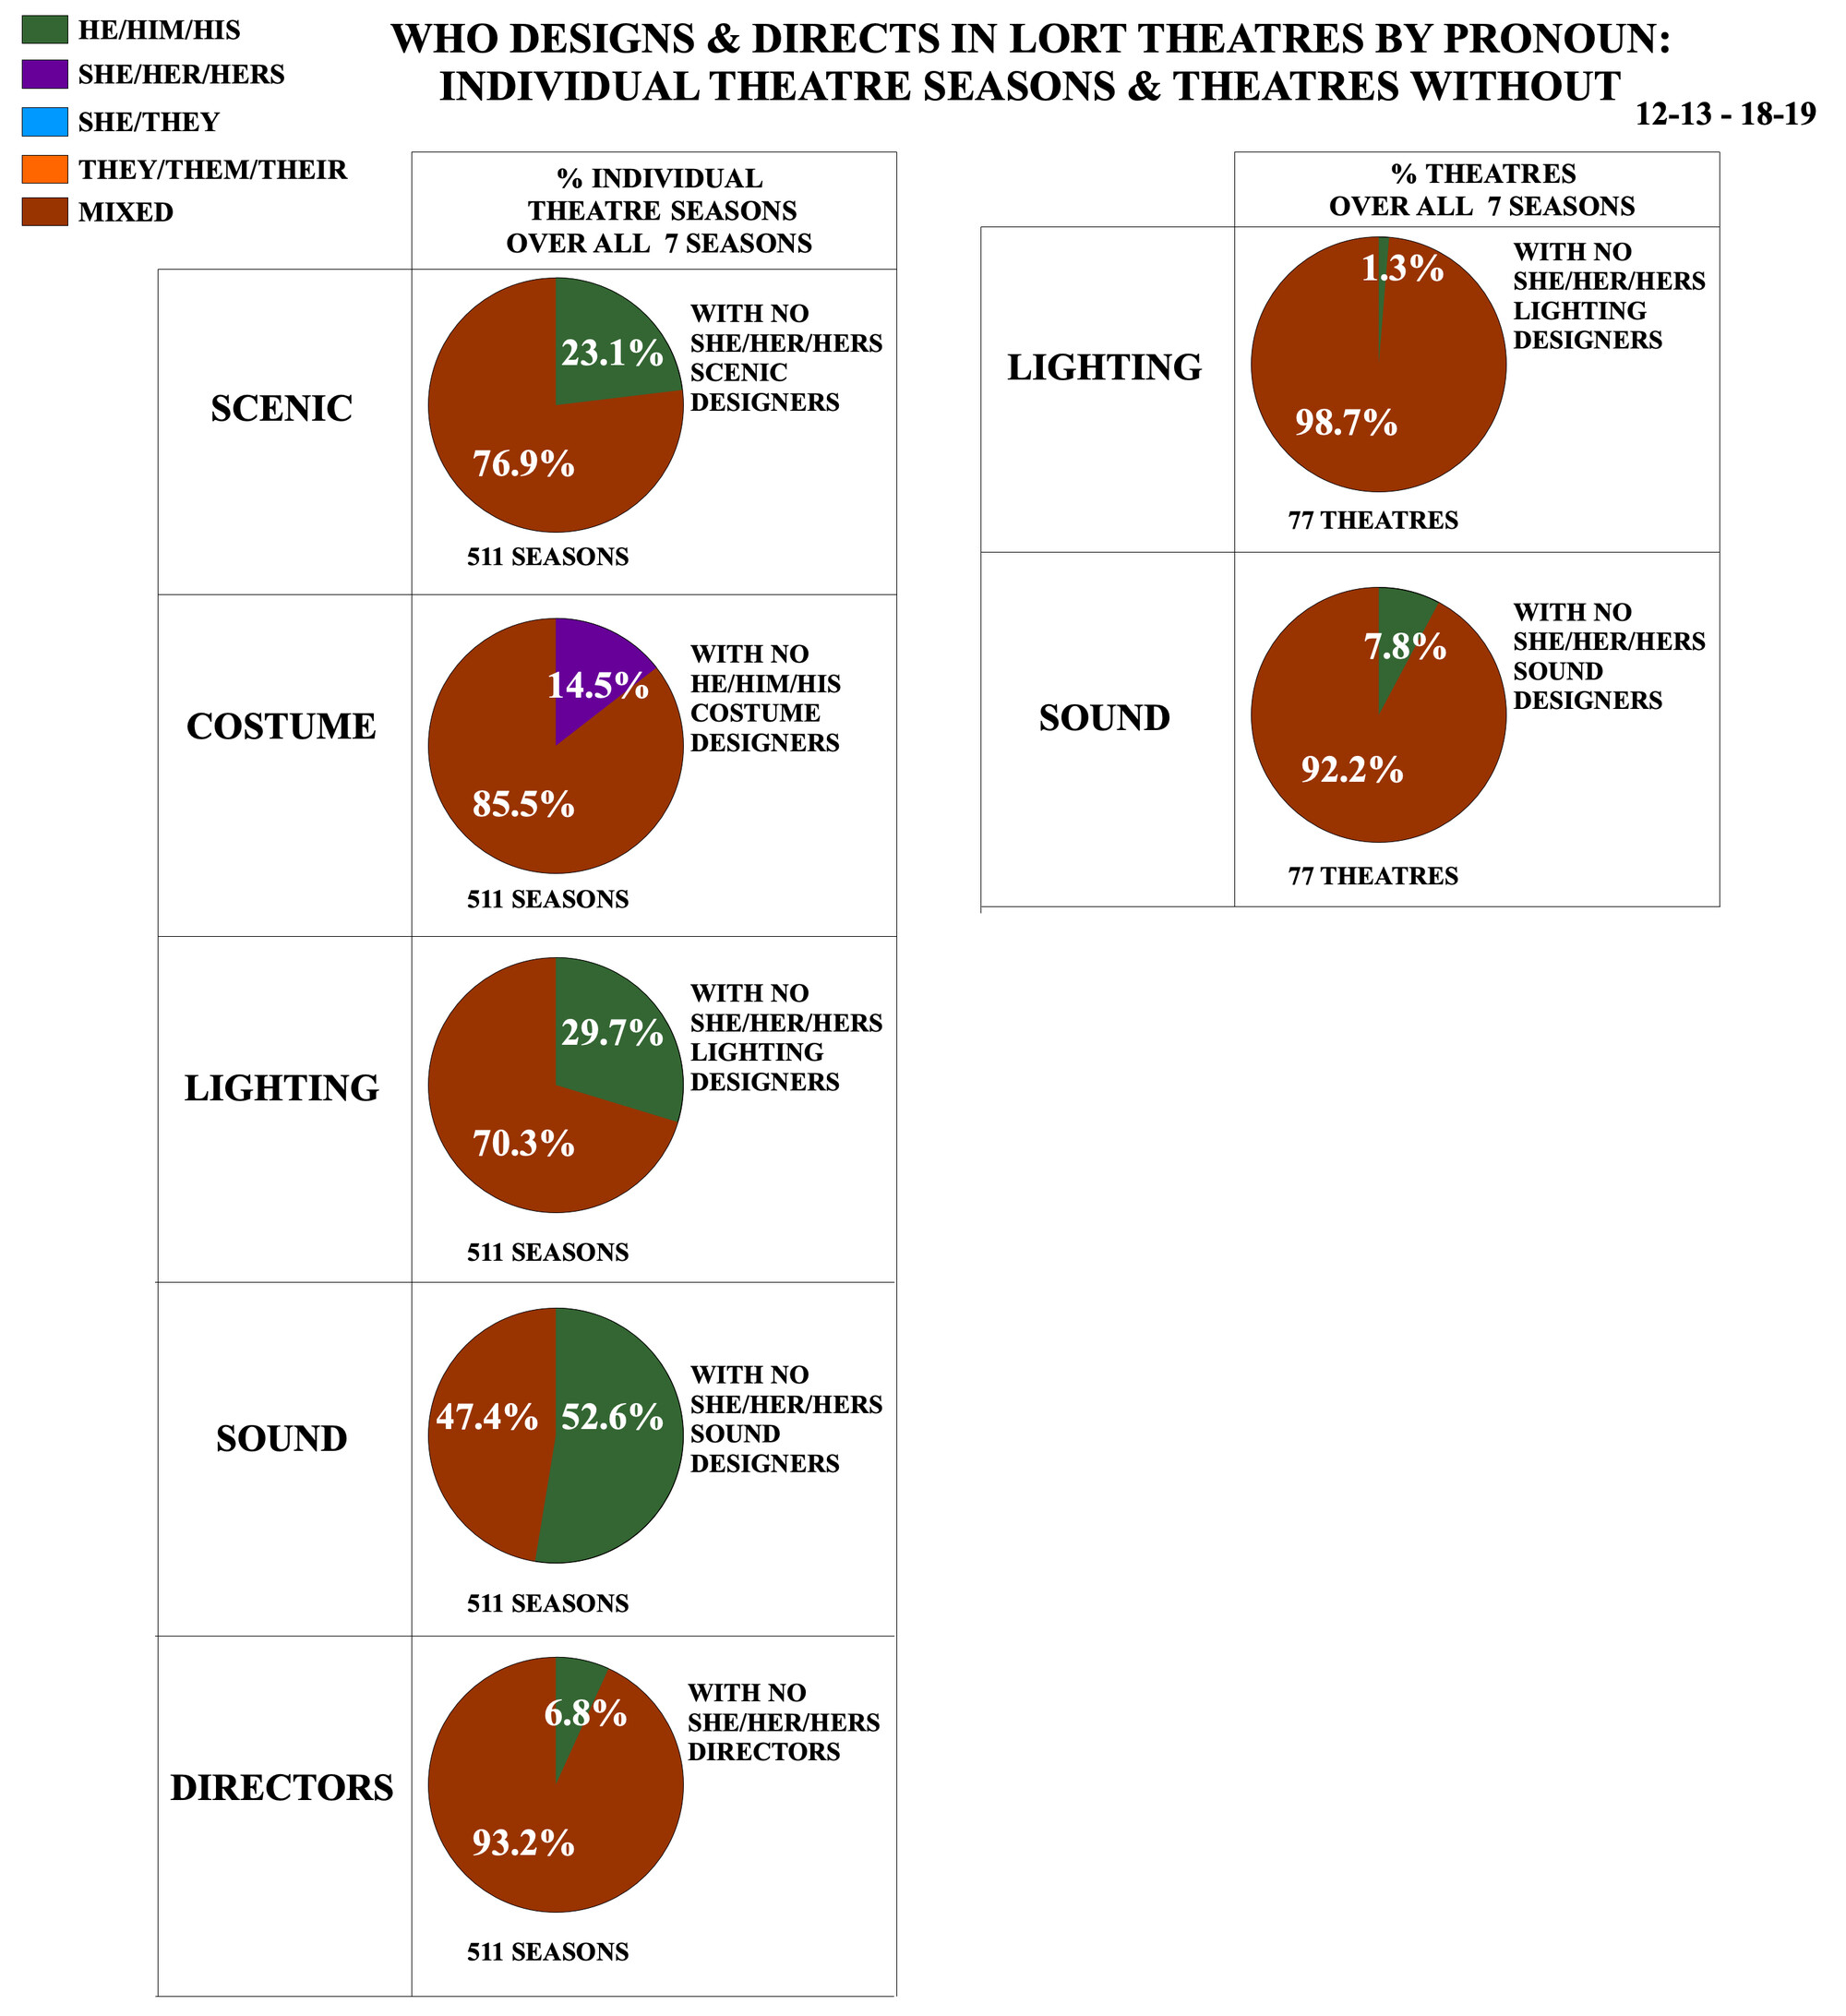
In total, 92.9 percent of the data from the 3720 productions over the past seven seasons was confirmed by the seventy-seven LORT member theatres. For the 2018–19 and 2019 seasons, 75.6 percent of the 554 productions were confirmed. However, all the graphs are based on both confirmed and unconfirmed information. Given that some theatres also confirmed previously unconfirmed data from past seasons, some statistics may be different than last year.
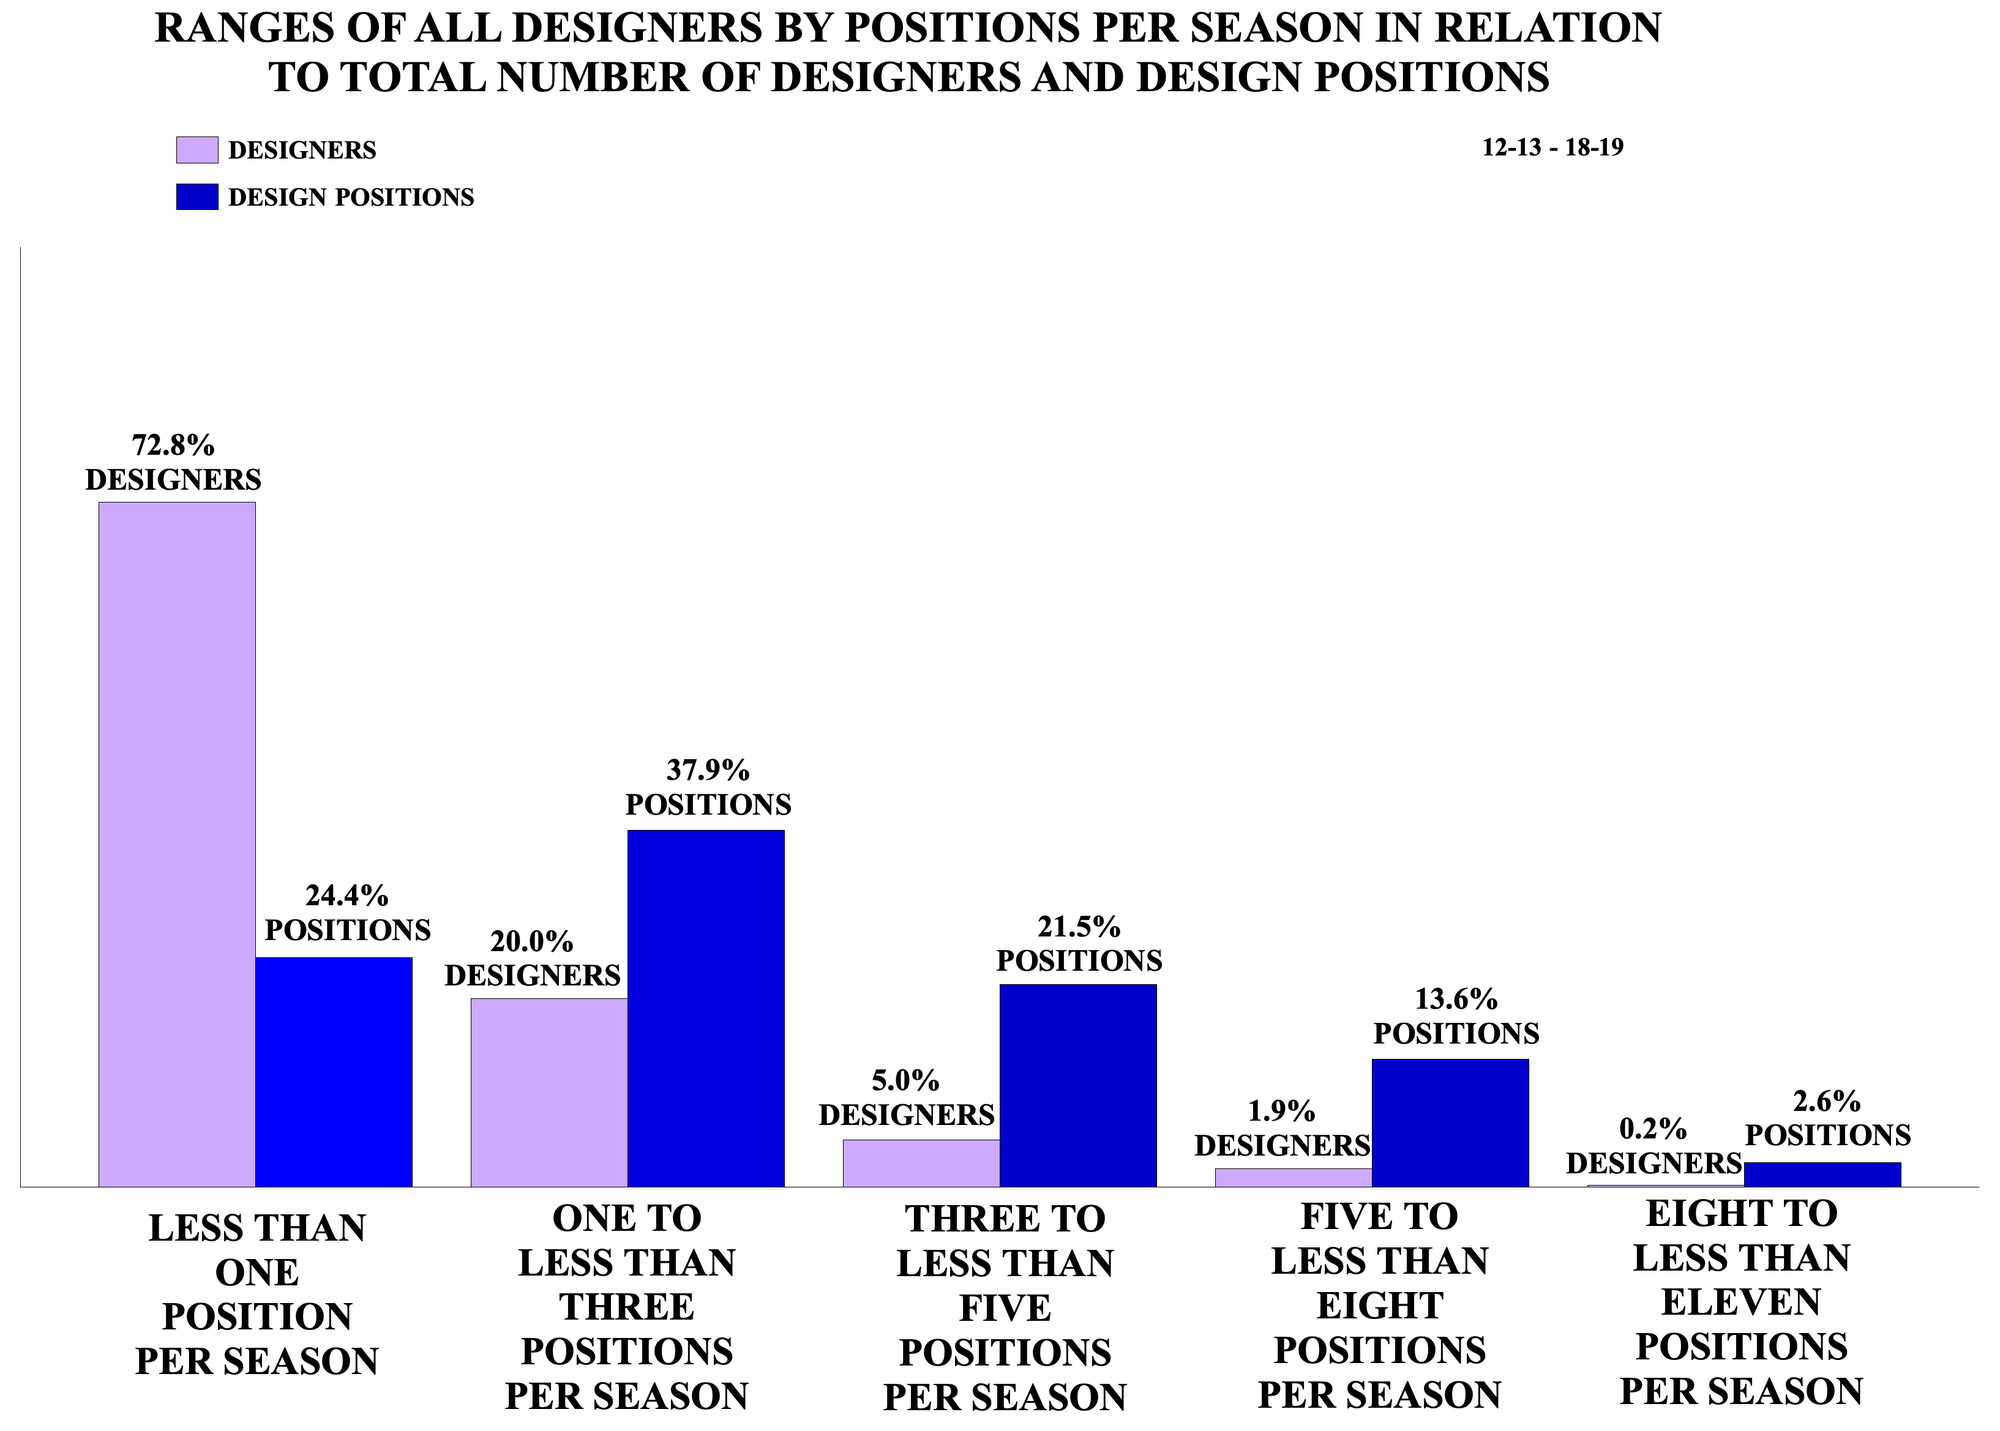
This year, I looked at the data in a few additional ways to more fully explore the gender statistics of designers, directors, and artistic directors working at LORT theatres. Instead of charts about how prolific designers are, I tried a new set of bar graphs that show the number of designers by positions held, per season, in relation to the total number of designers and design positions. I’m hopeful these graphs will lead to deeper conversations about the stereotype that “designers just design too many shows.” As ever, these numbers should not be taken as the totality of a designer’s or director’s work for a season. I also clarified between percentage points and percentages in the chart narratives.
Please note that some of the yearly percentages are based on very small numbers of positions, particularly in the projection/video design discipline and in certain stage categories. Percentages are rounded to one decimal point, which resulted in some graphs not equaling 100 percent exactly. And, as always, correlation is not causation.
Trends and Takeaways
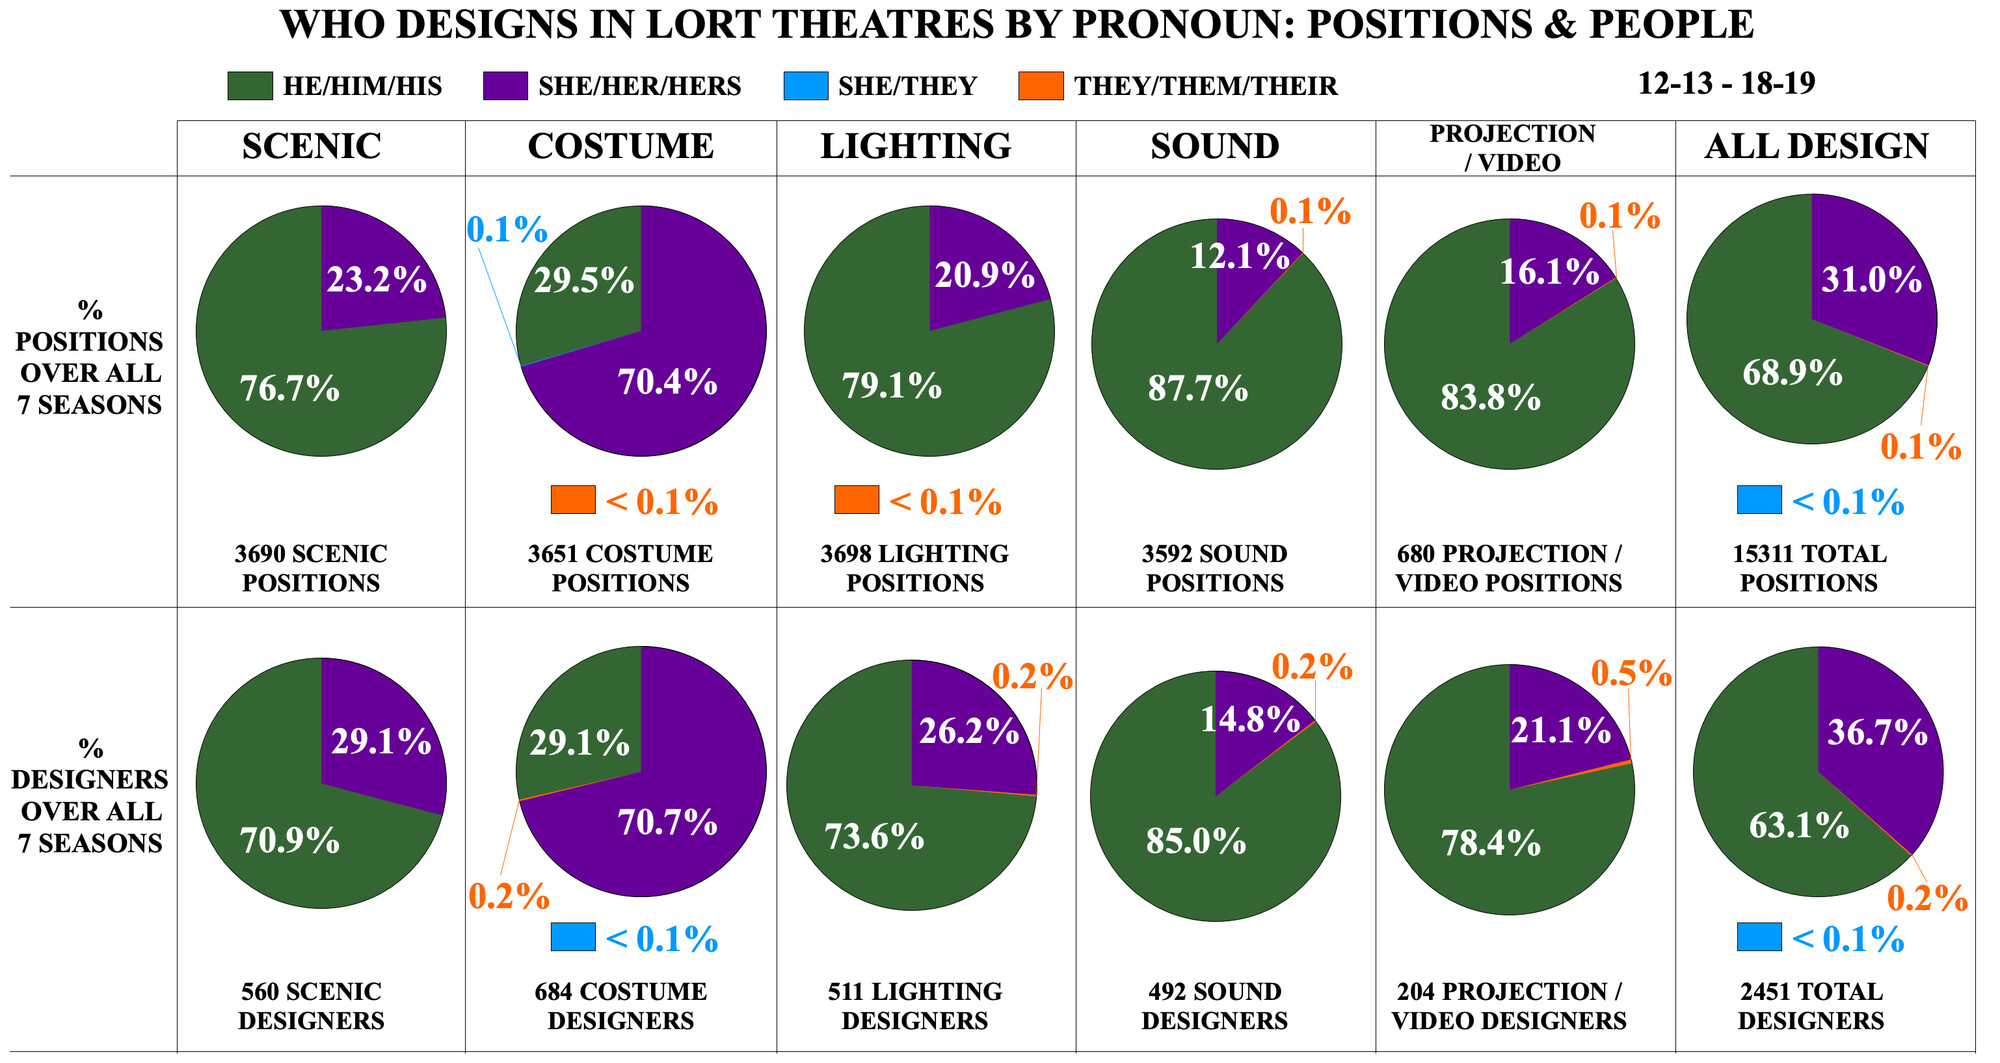
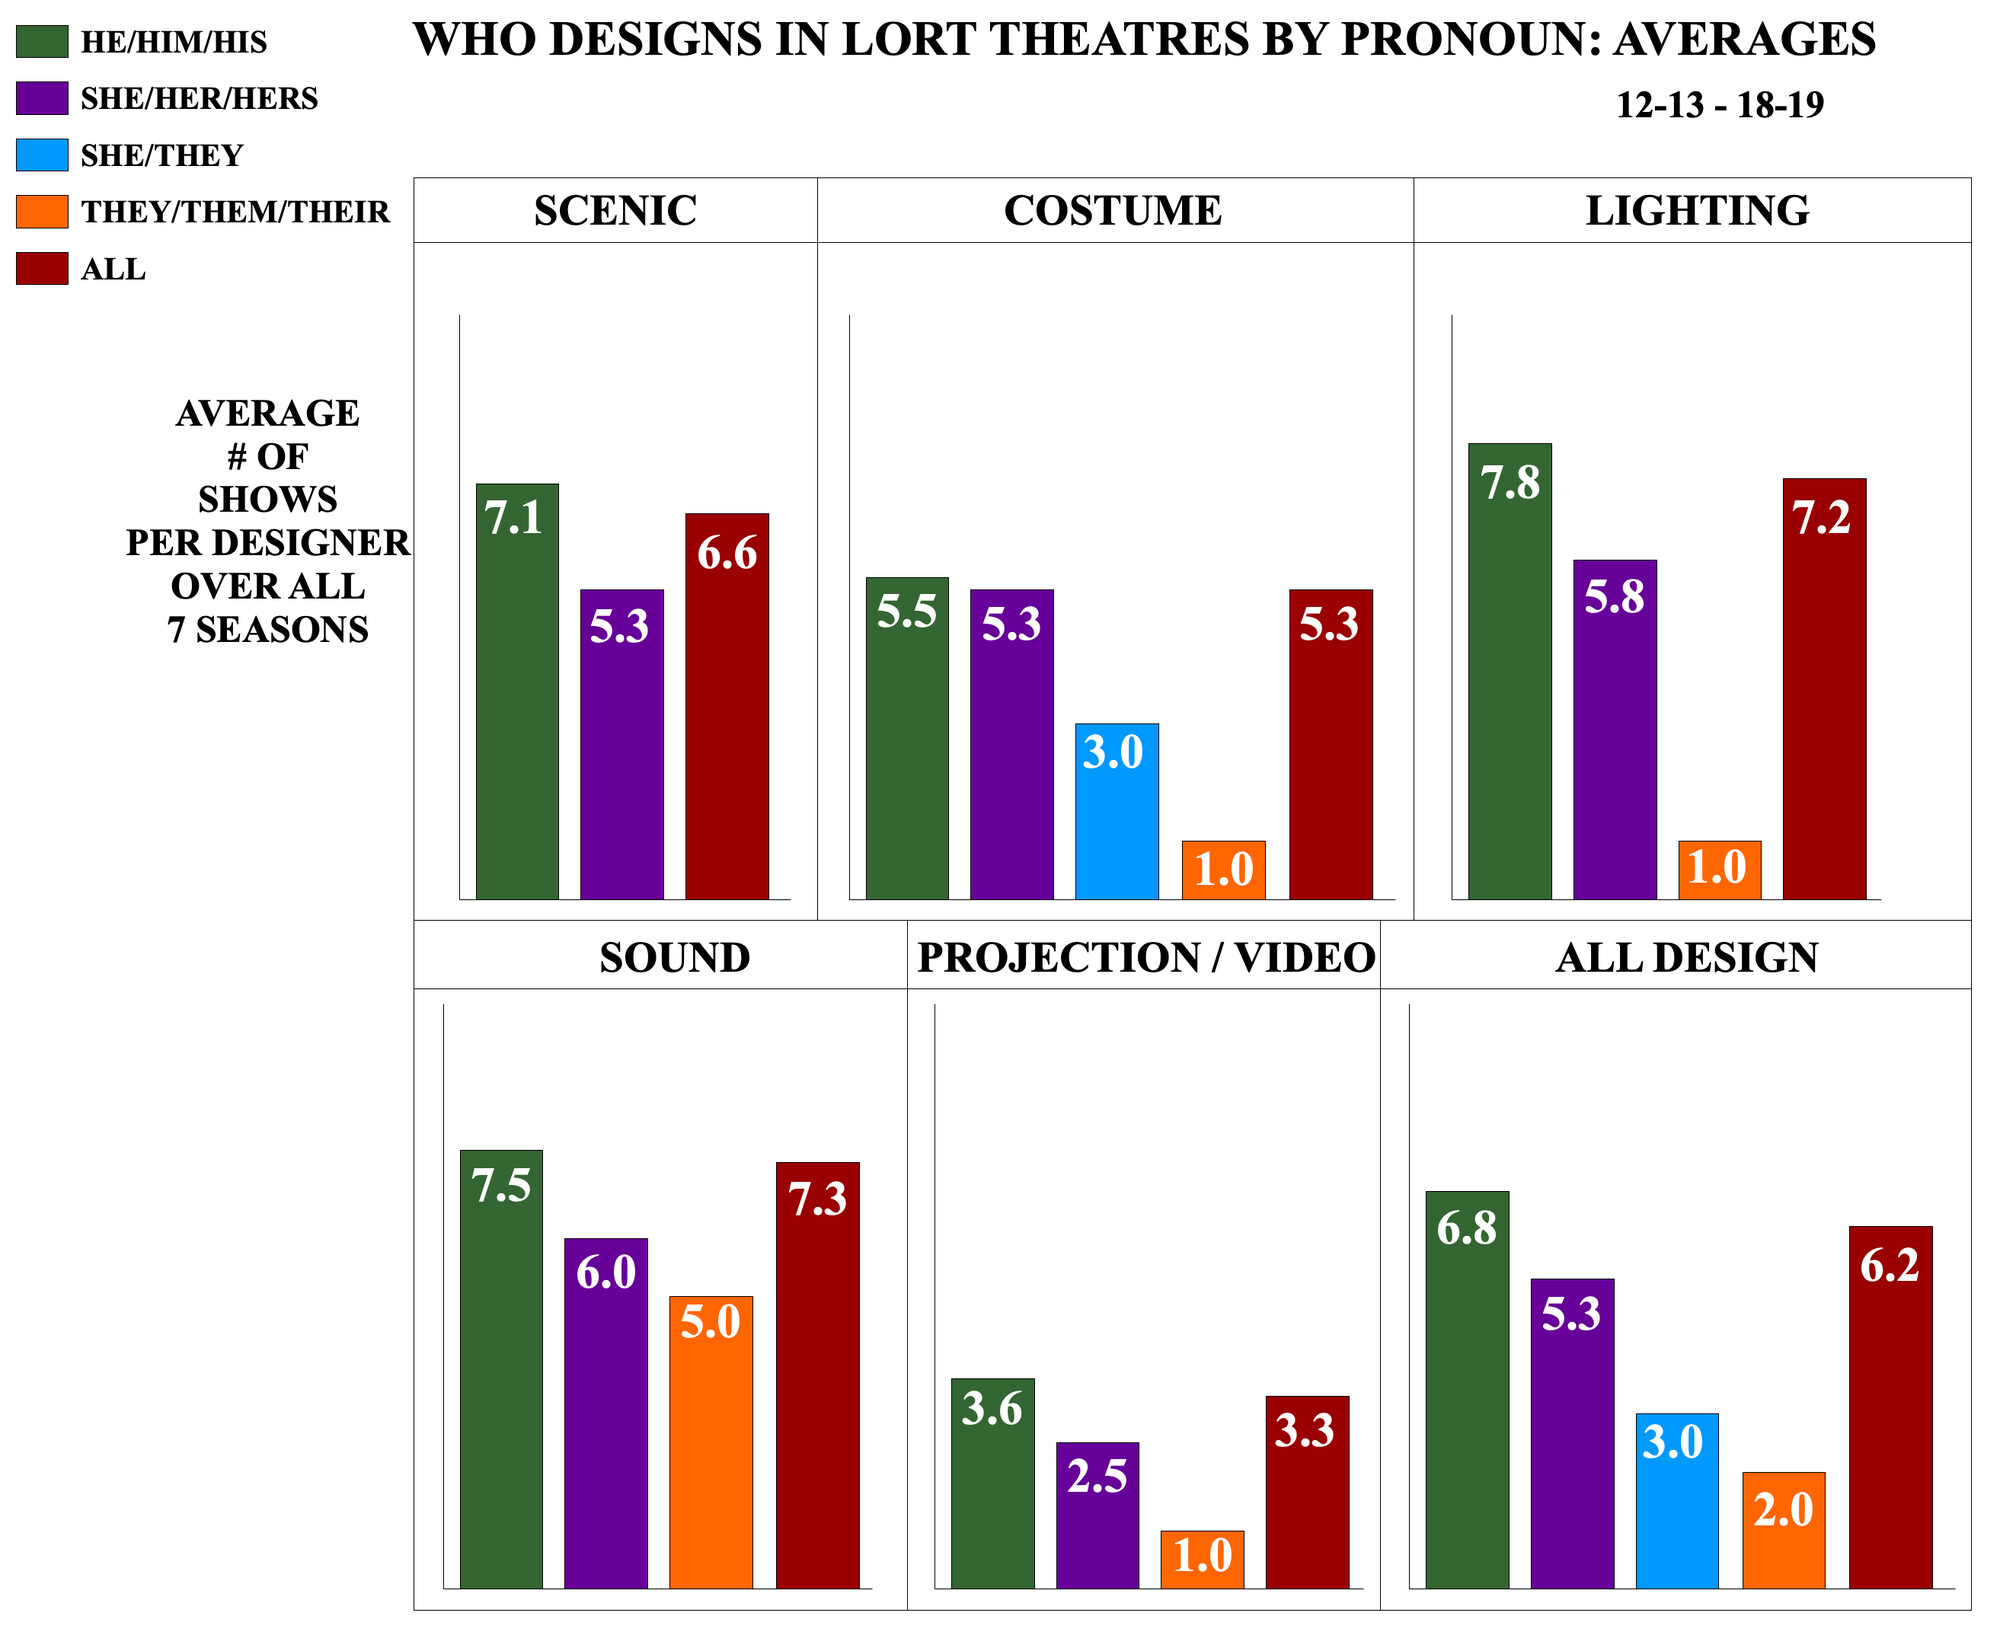
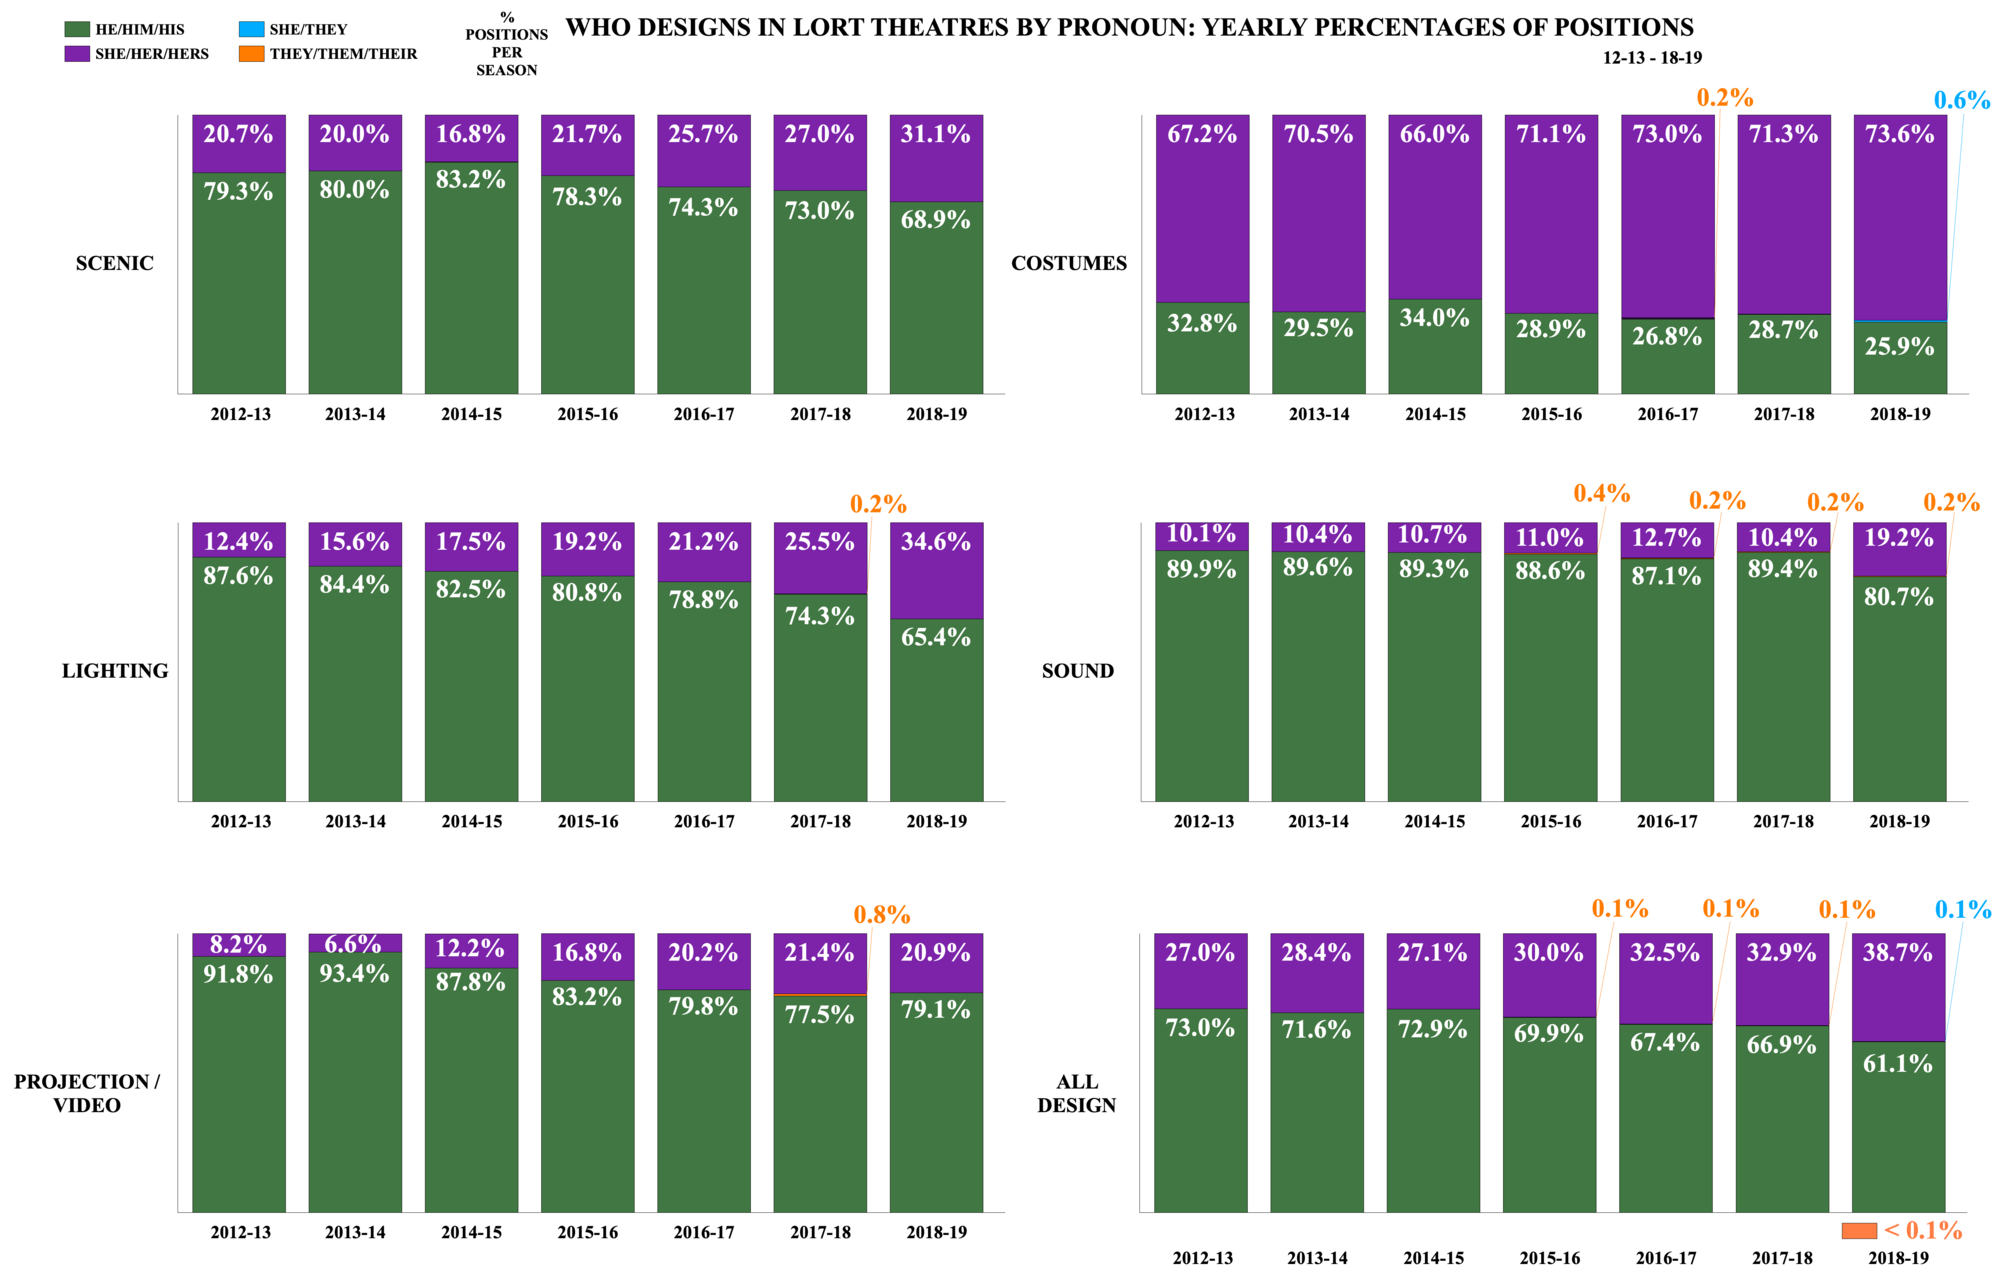
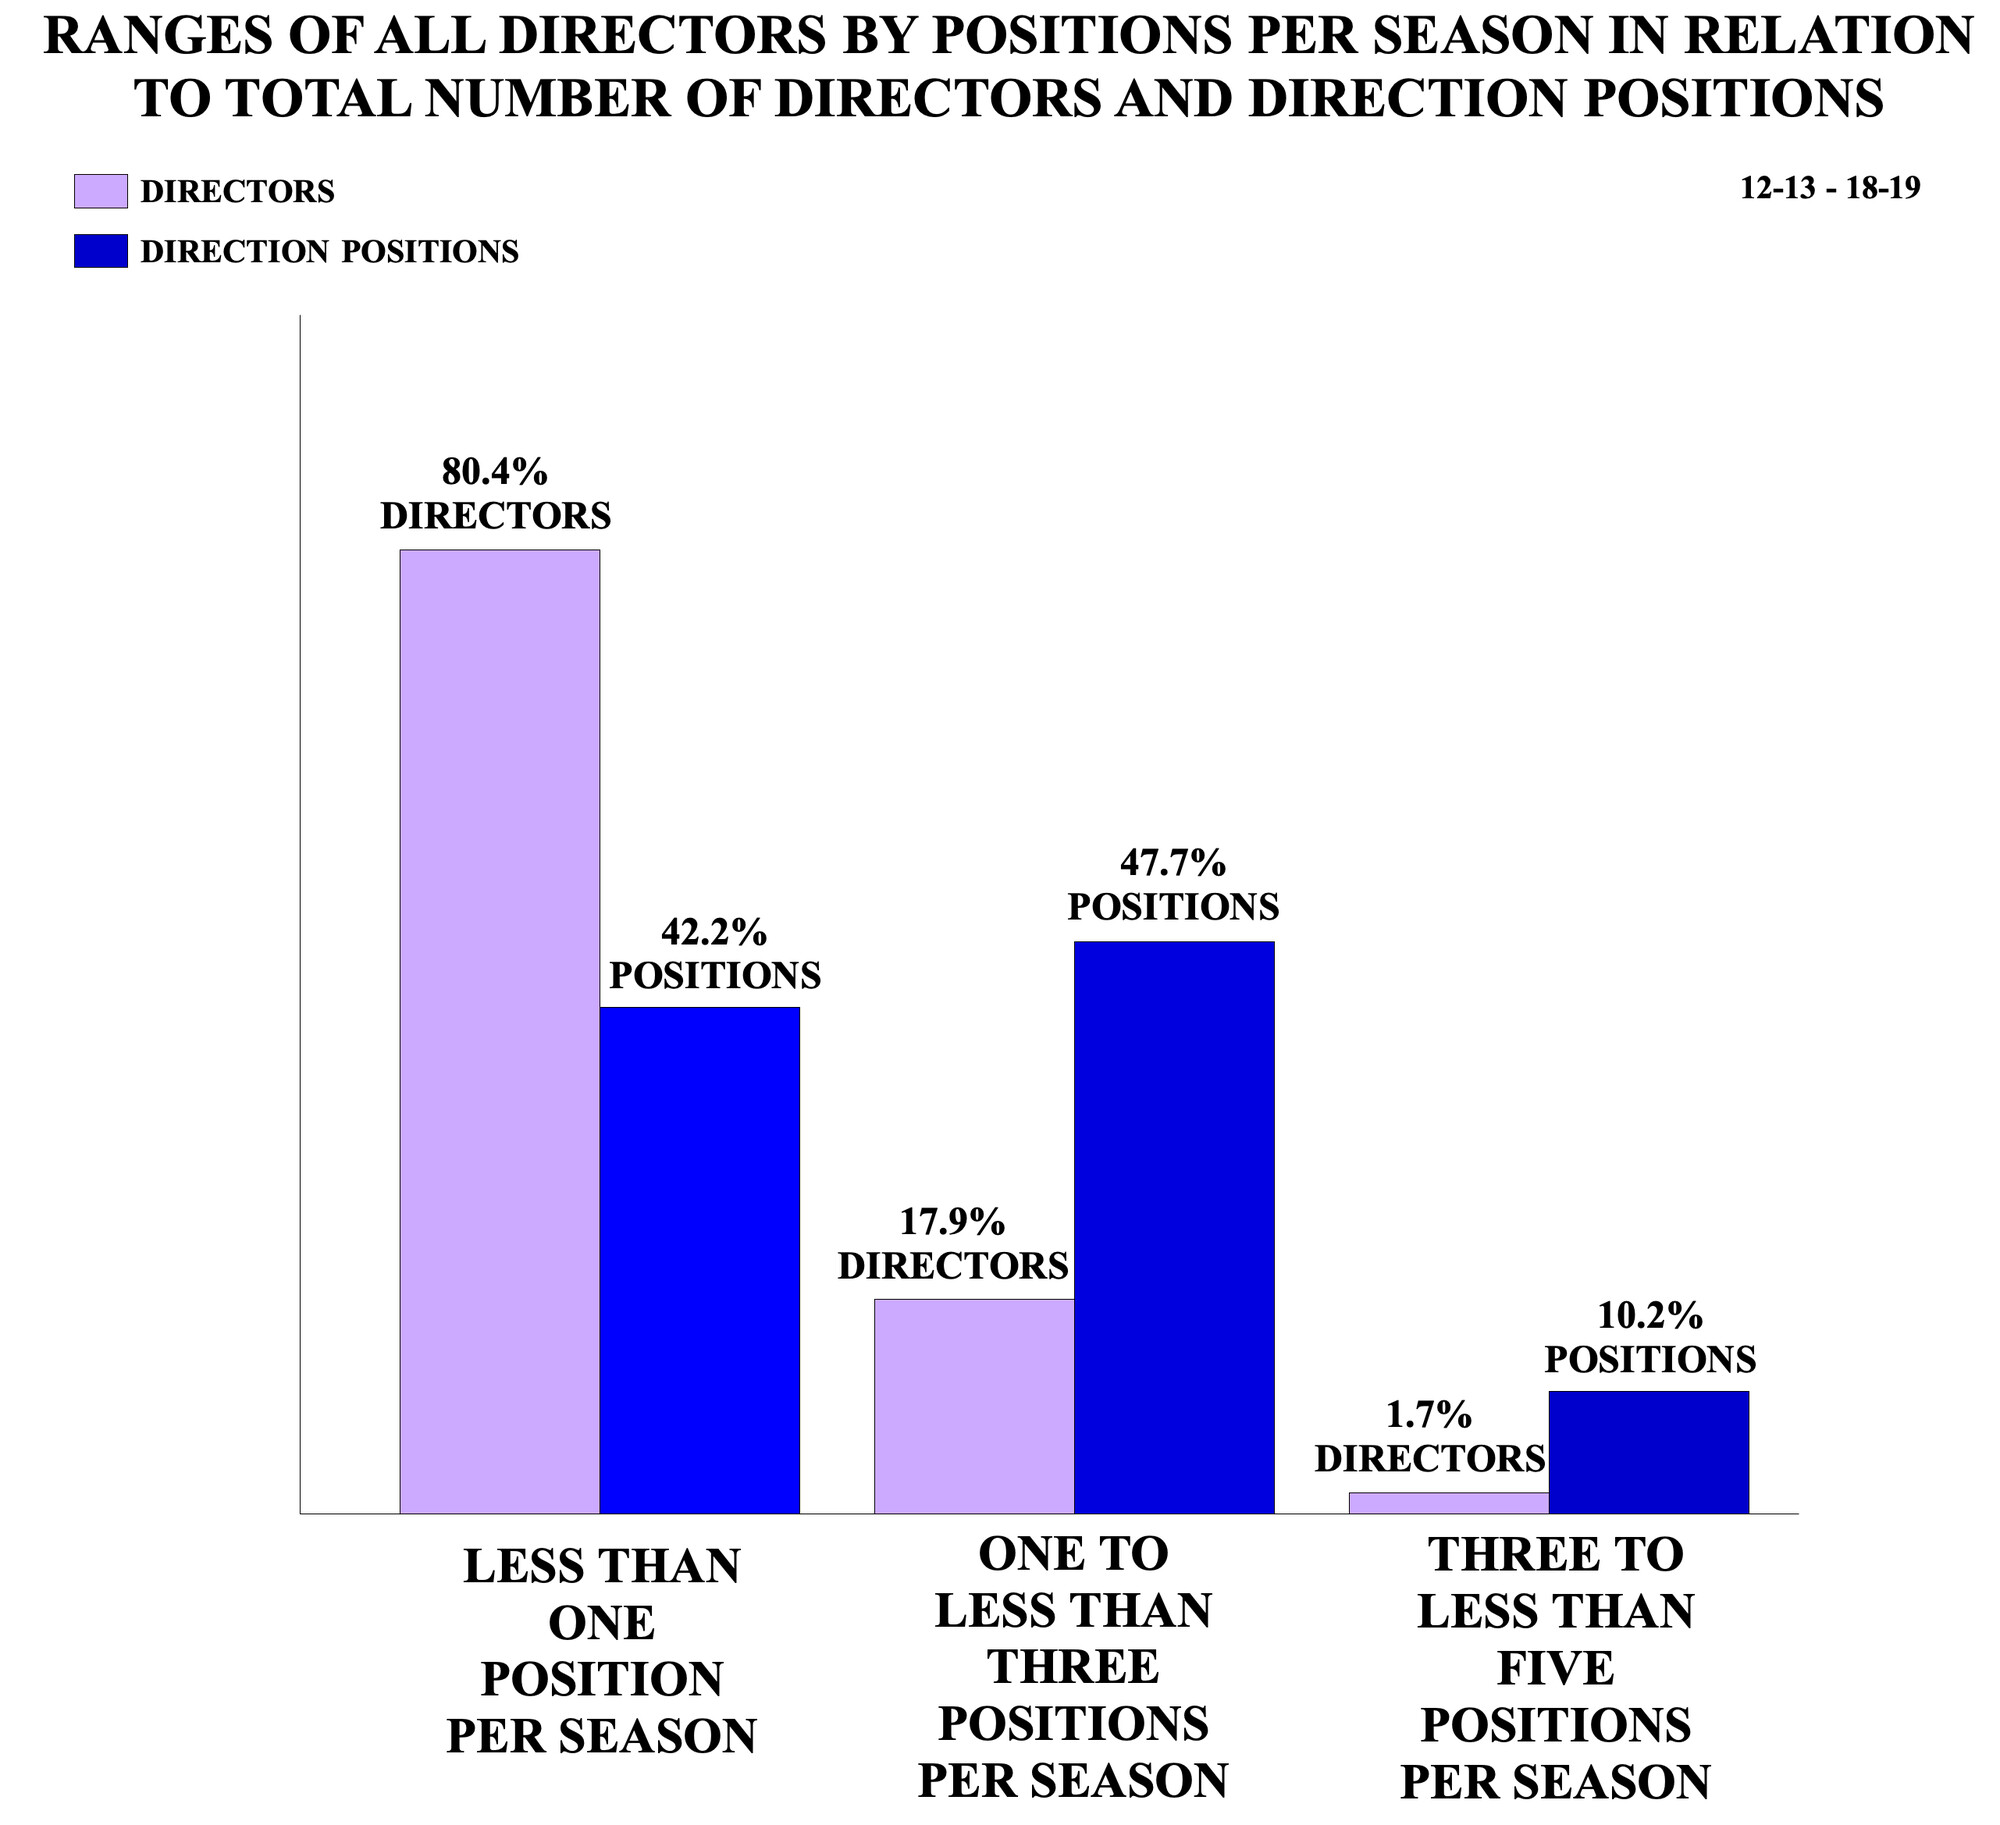
Over the seven seasons studied, 37.1 percent of all designers held one LORT position or less, which is 32.3 percent of all he designers, 37.7 percent of all she designers, and 75.0 percent of all they designers. Looking at yearly percentages of design team breakdowns, 2018–19 shows significant increases in the number of teams with more than one she designer, in all she teams, and in teams with only one she designer in sound, and there were corresponding decreases in all he teams and teams with only one she designer in costumes.
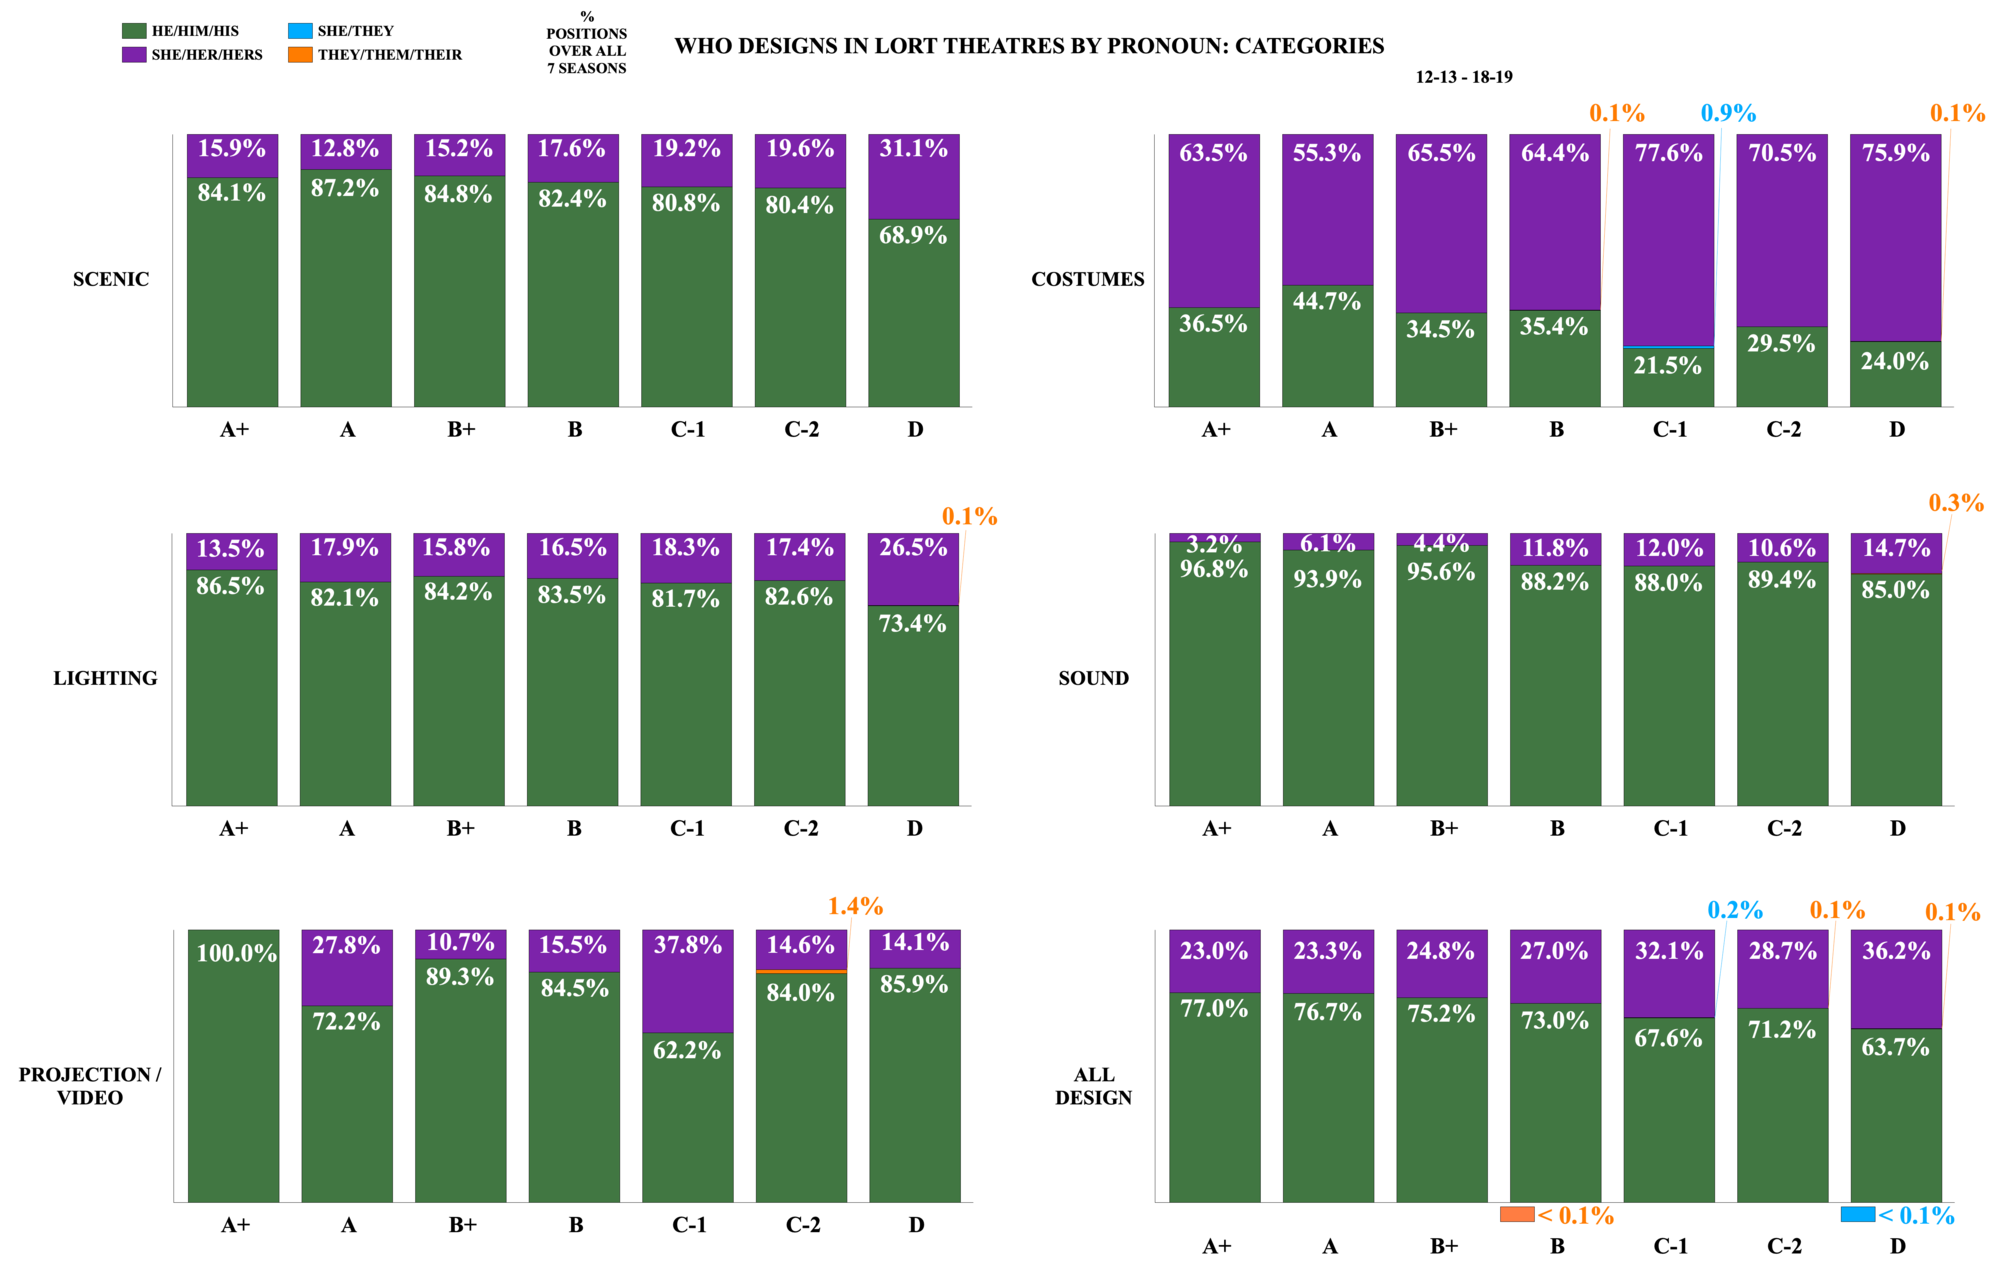
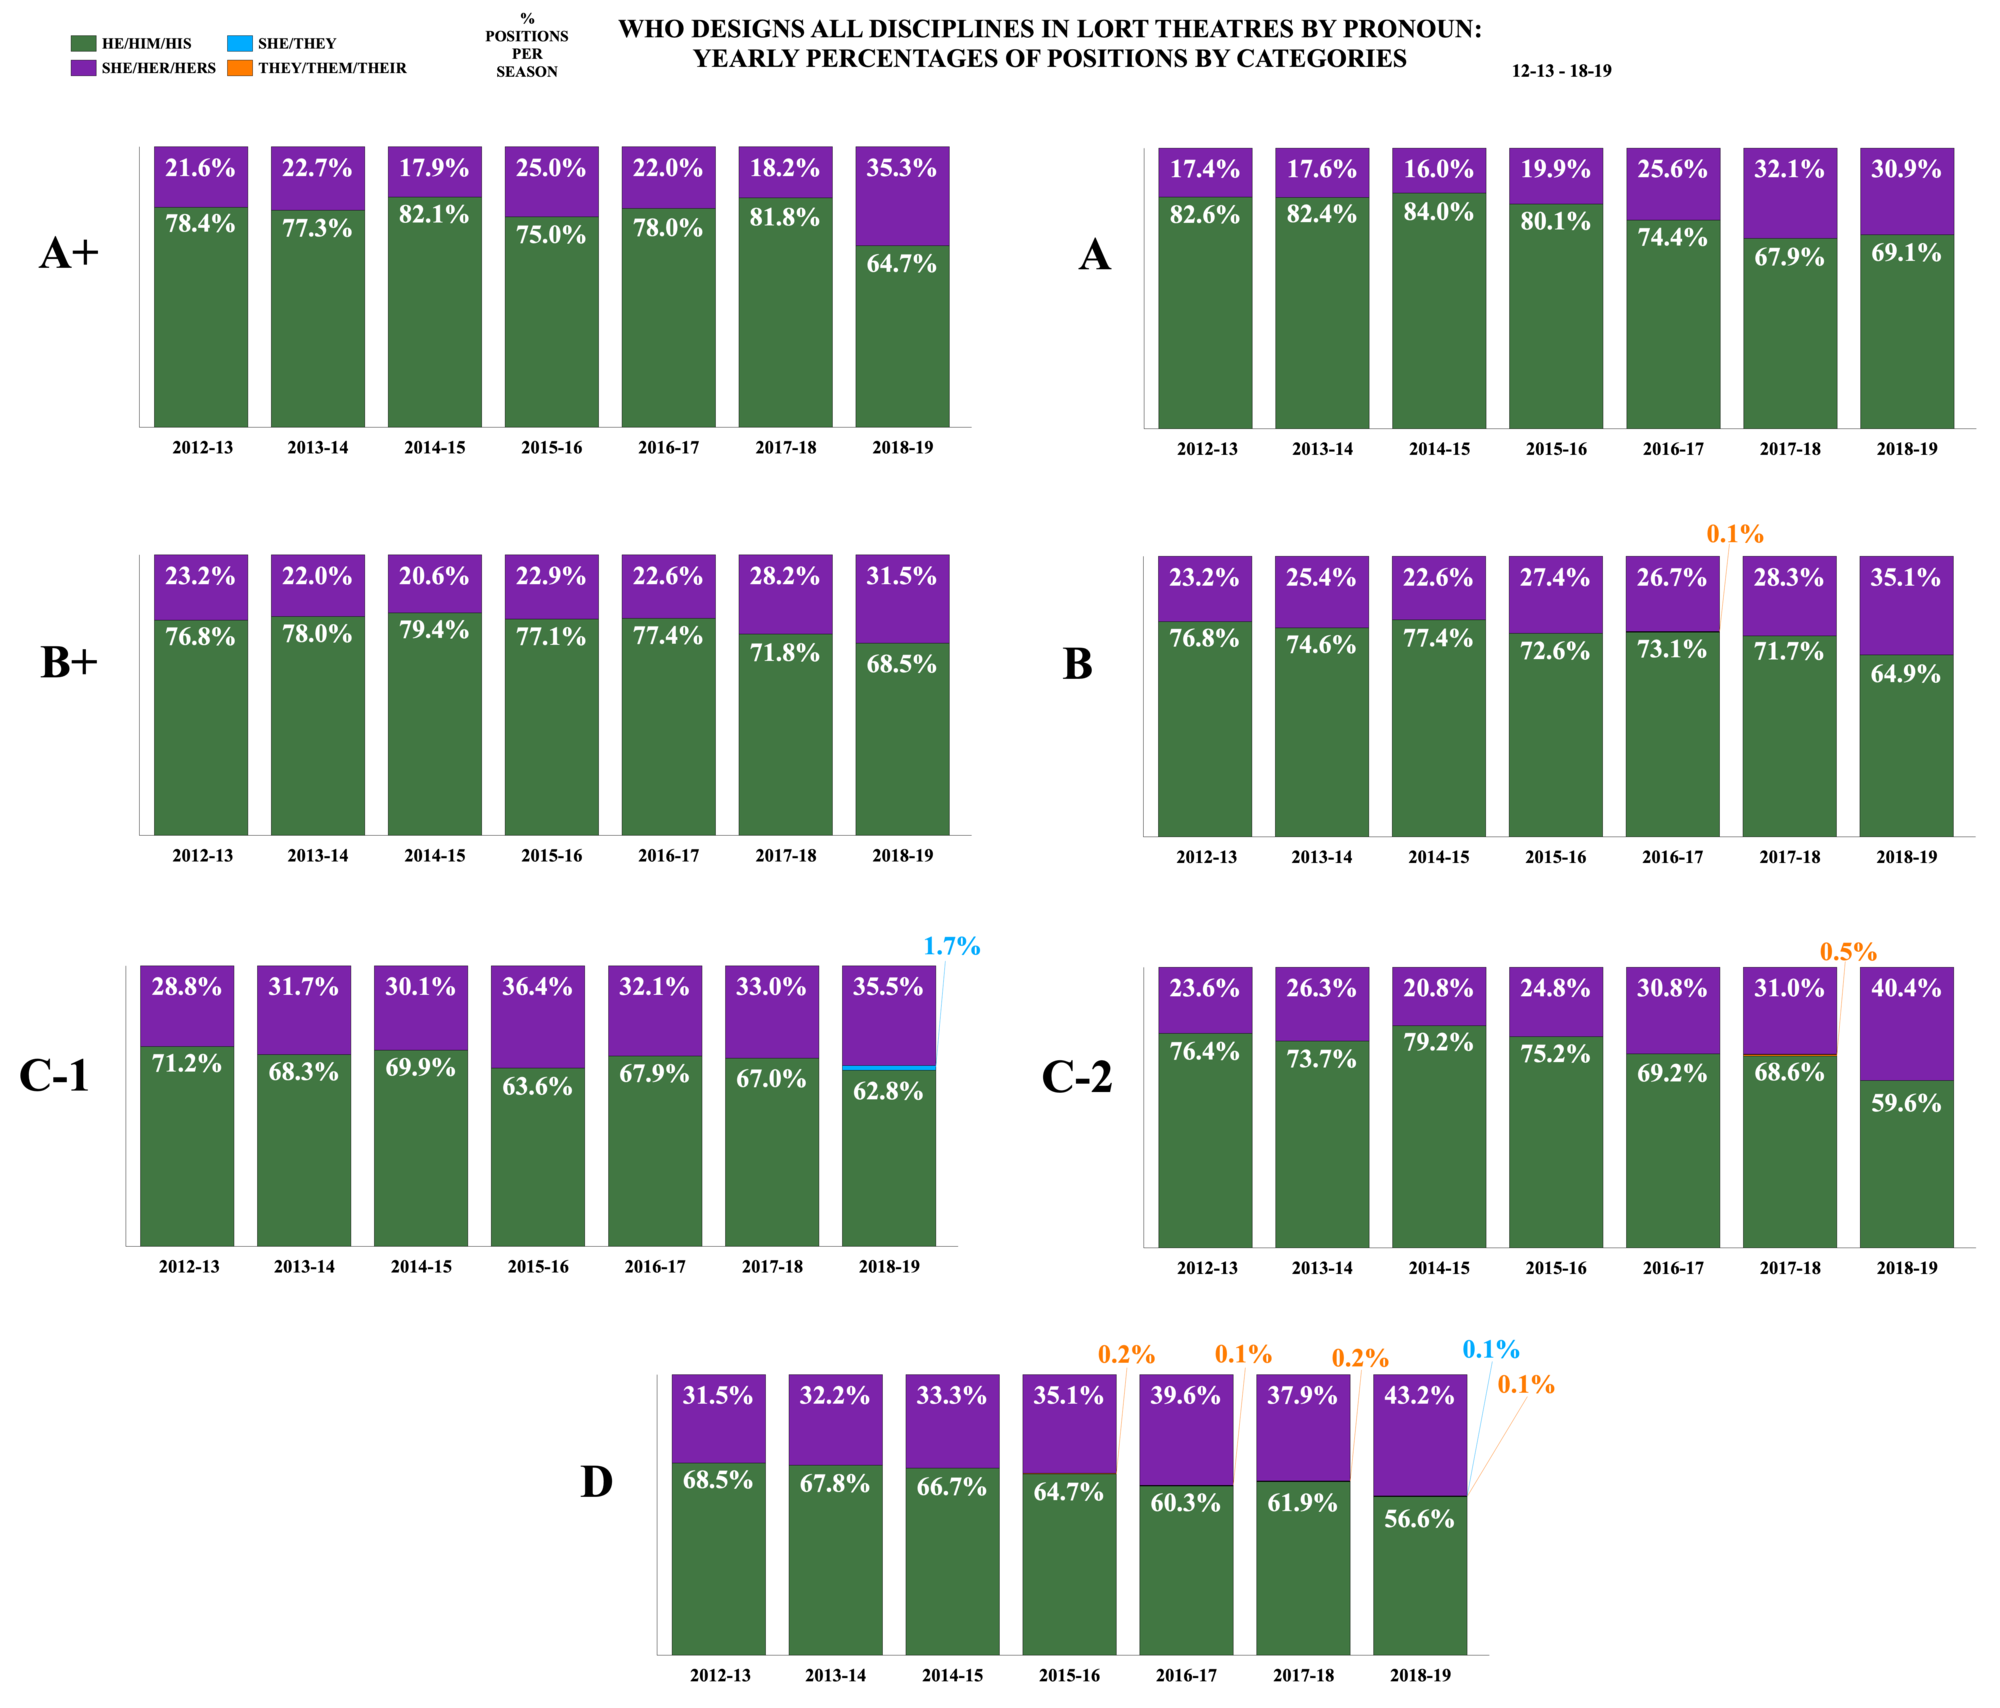
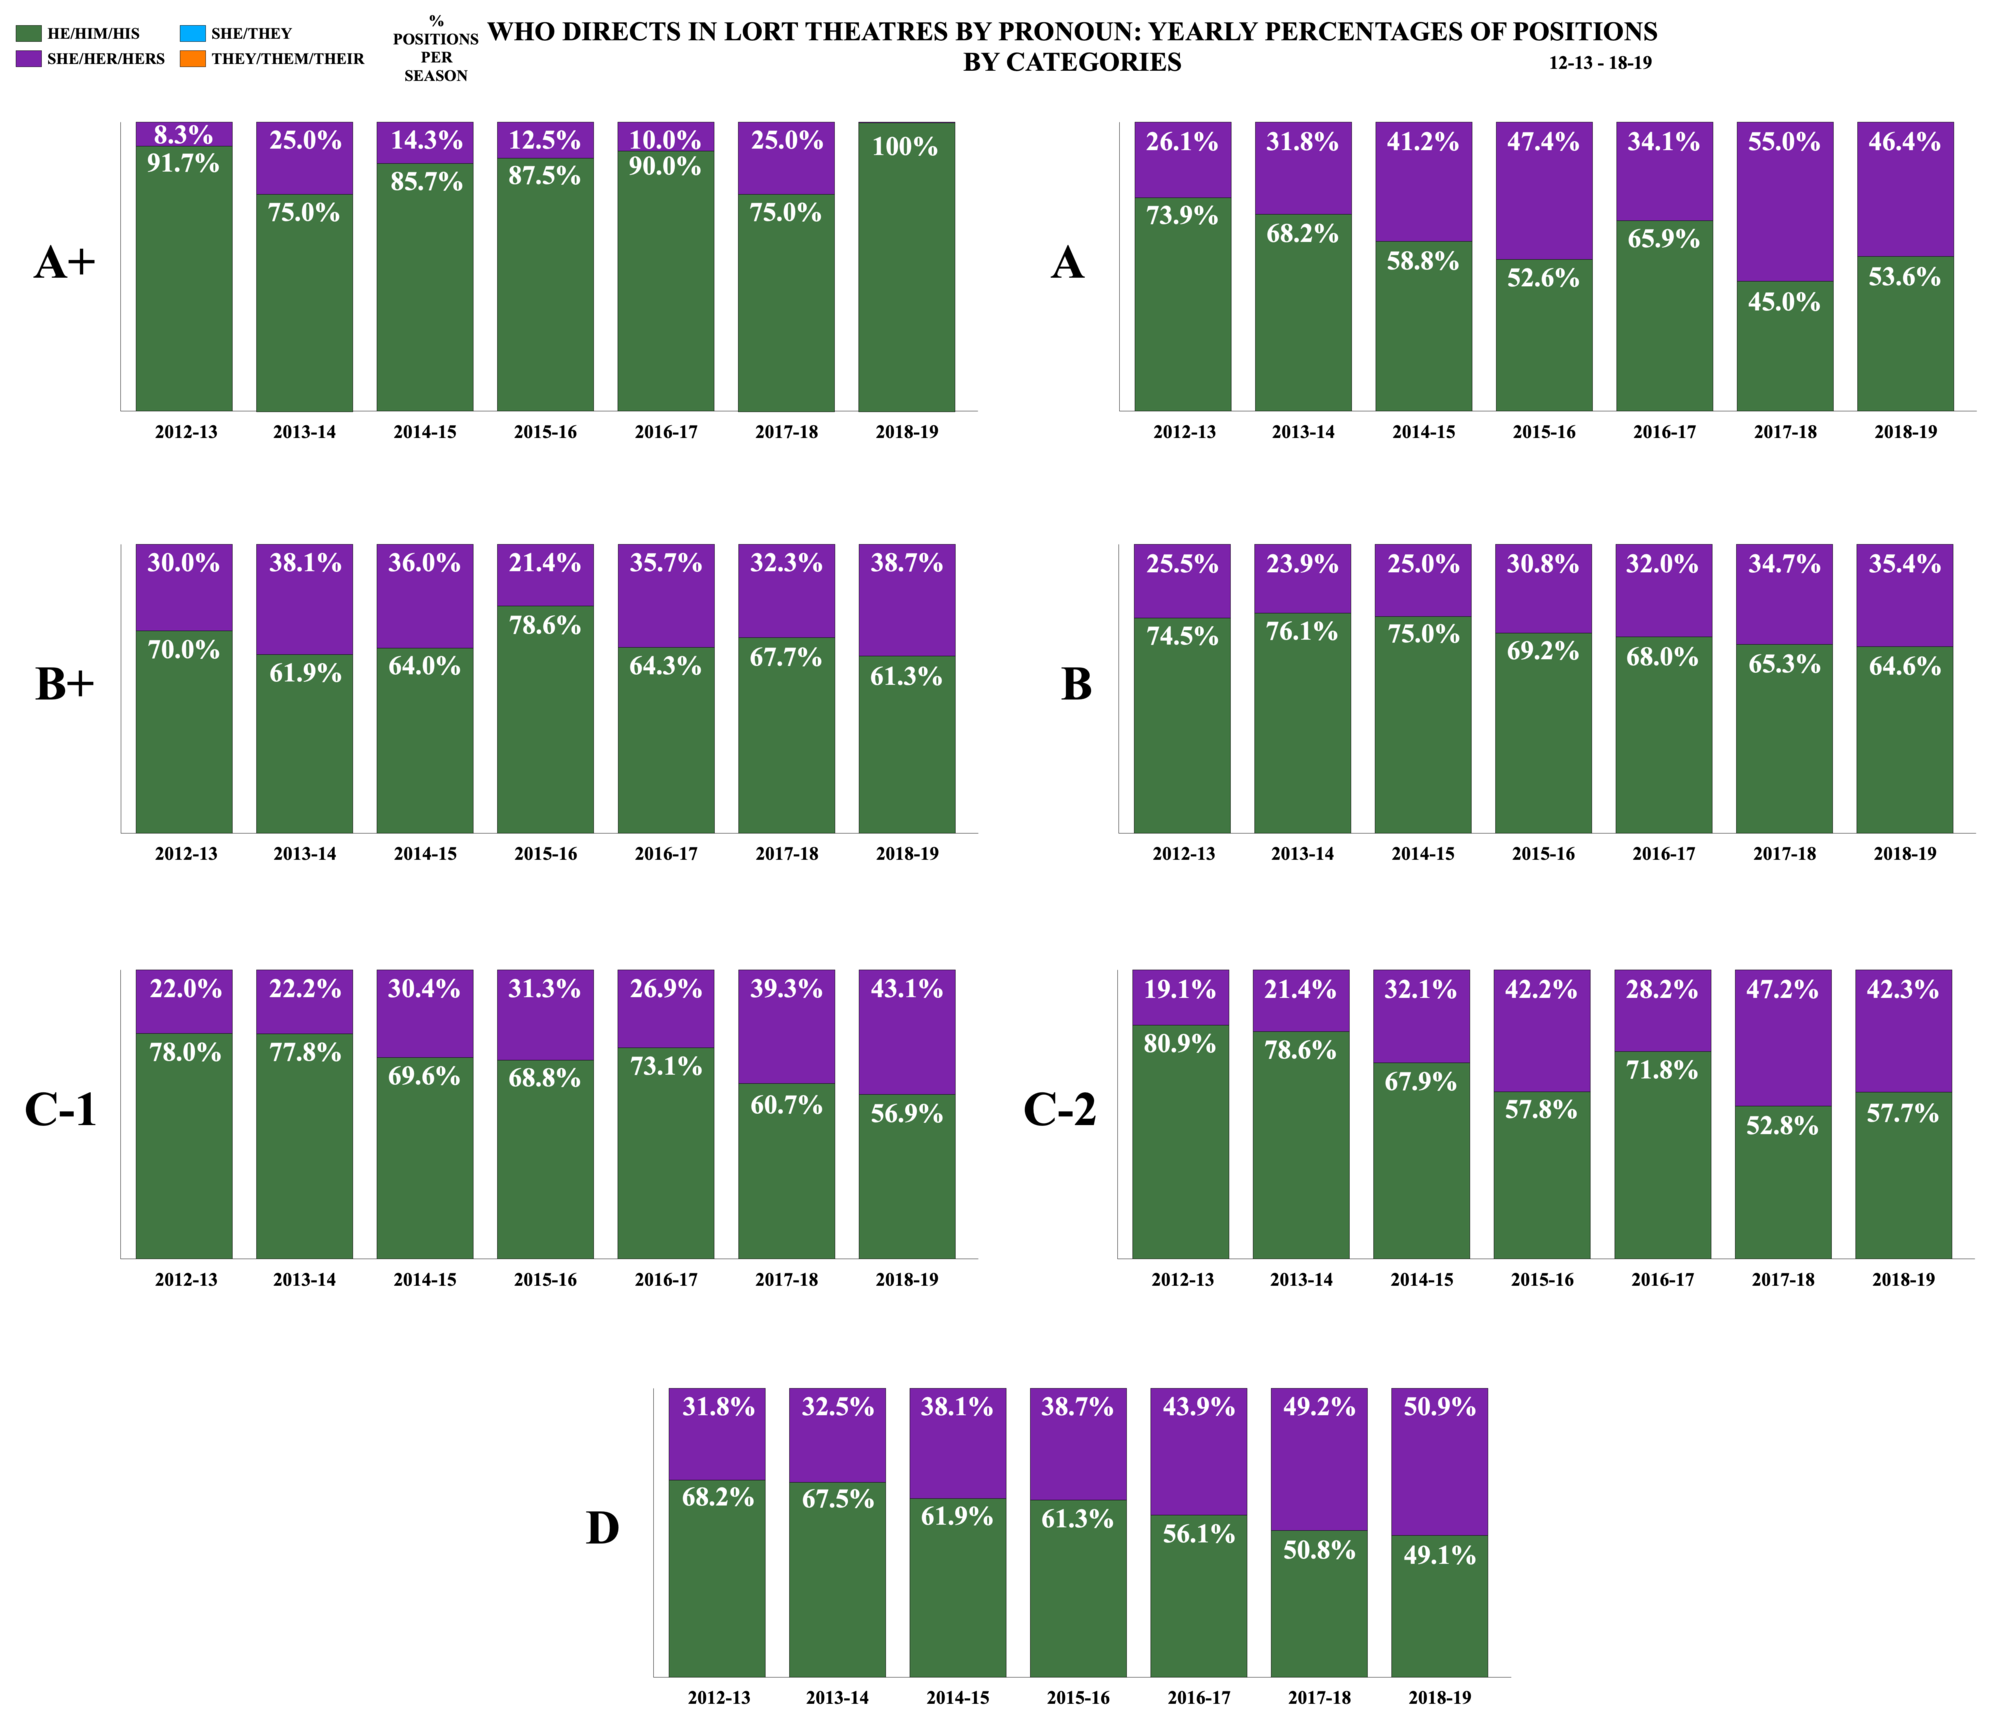
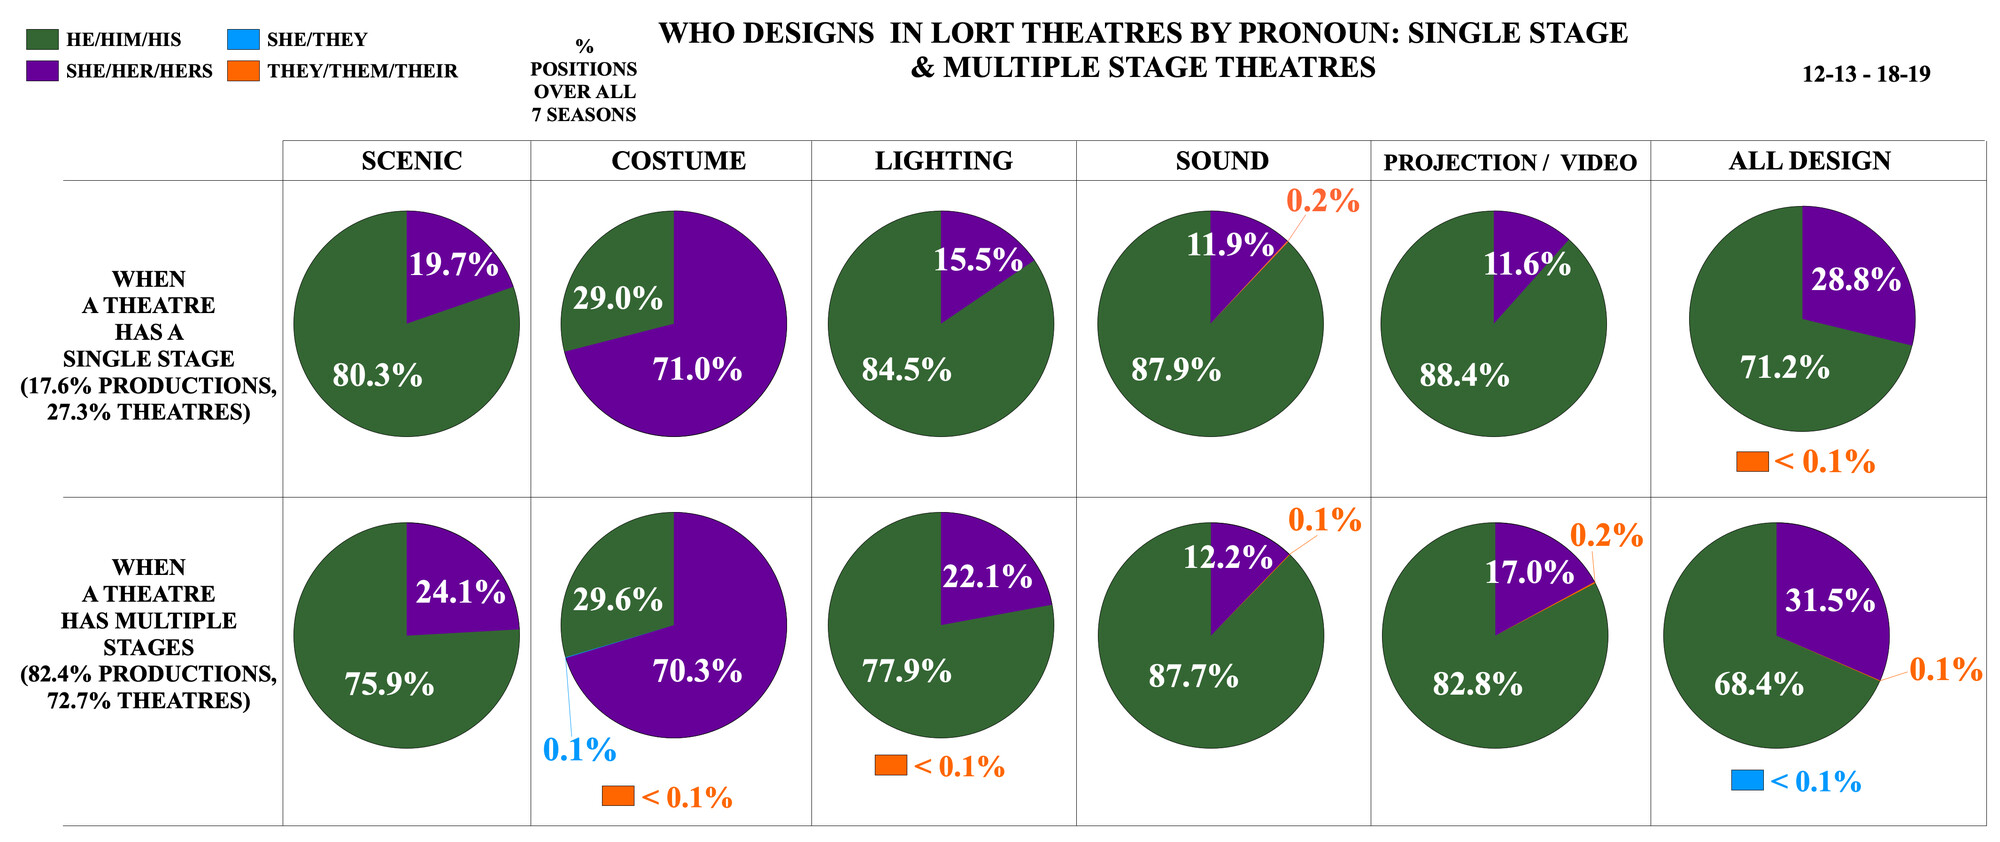
When we examine who designs in LORT theatres by stage categories, a fairly clear pattern emerges: as the stage categories (and thus minimum fees paid to designers) go up, the percentages of she designers go down. Over the seven years studied, the lowest percentage difference between she designers in A+ and D stage categories has been 11.5 percentage points, in sound design, while the highest percentage difference has been 15.2 percentage points in scenic design.
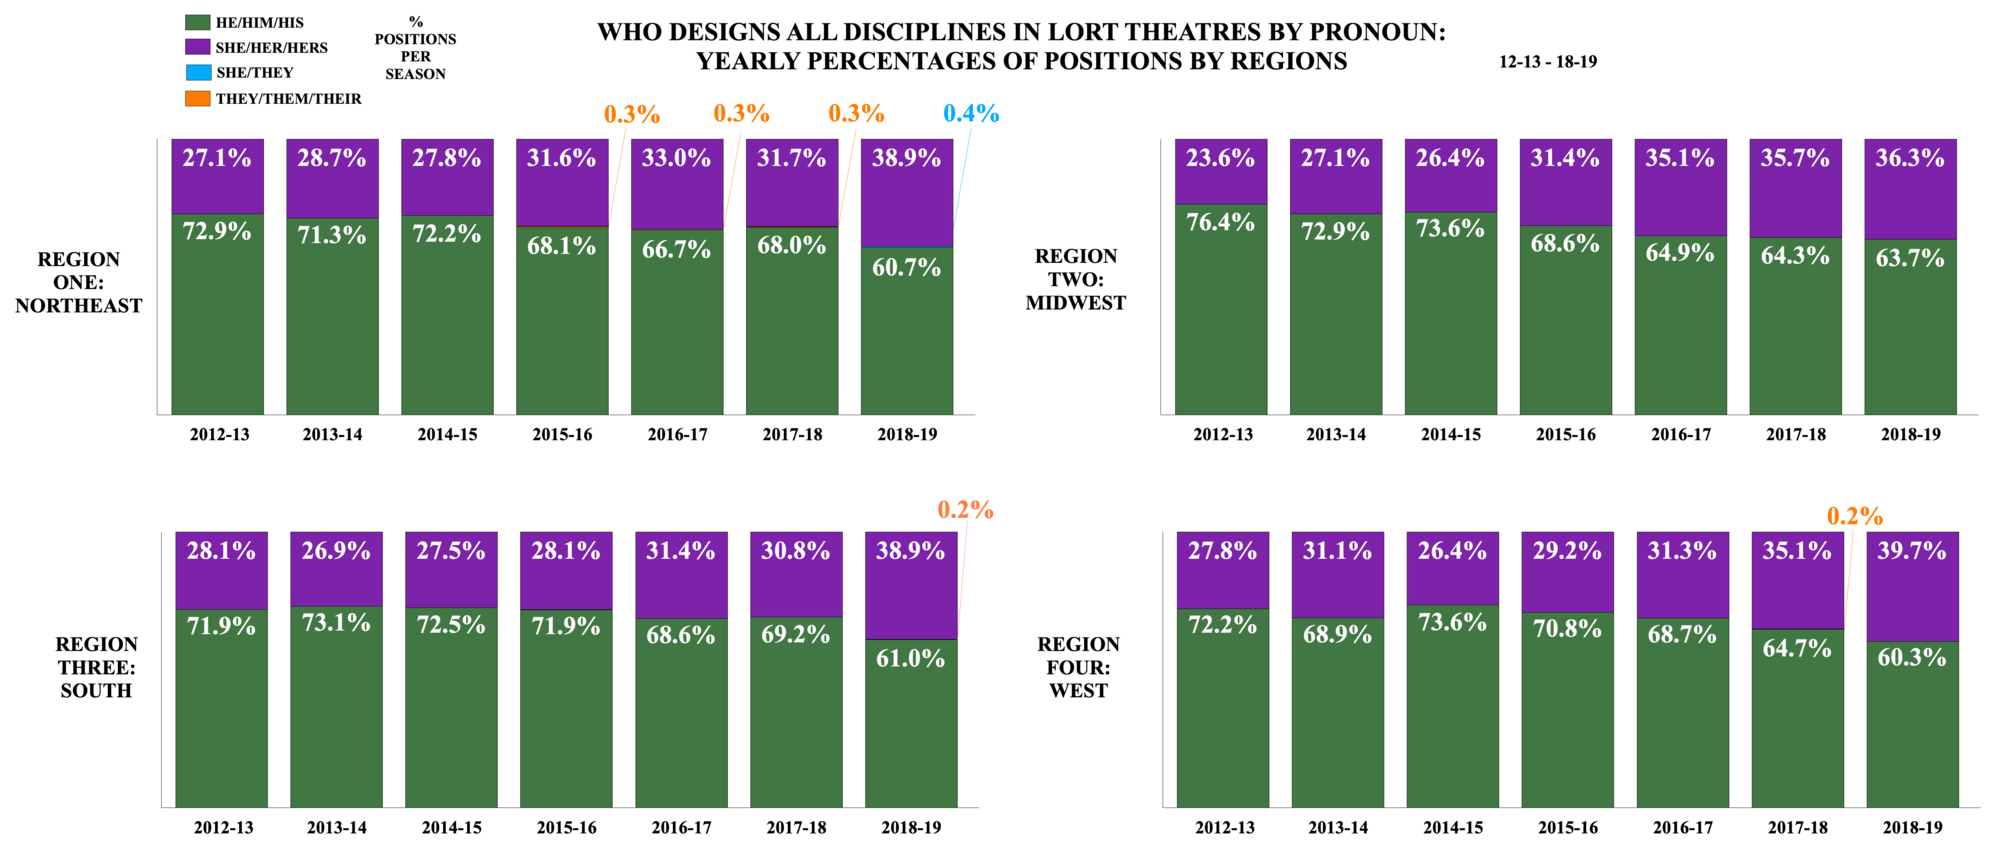
When we look at yearly percentages of who designs by discipline, there’s a clear pattern as well: as the years have passed, there has been a larger percentage of she designers. This pattern is due to a greater number of theatres hiring more she designers, not because there were fewer she designers capable in 2012–13 than in 2018–19.
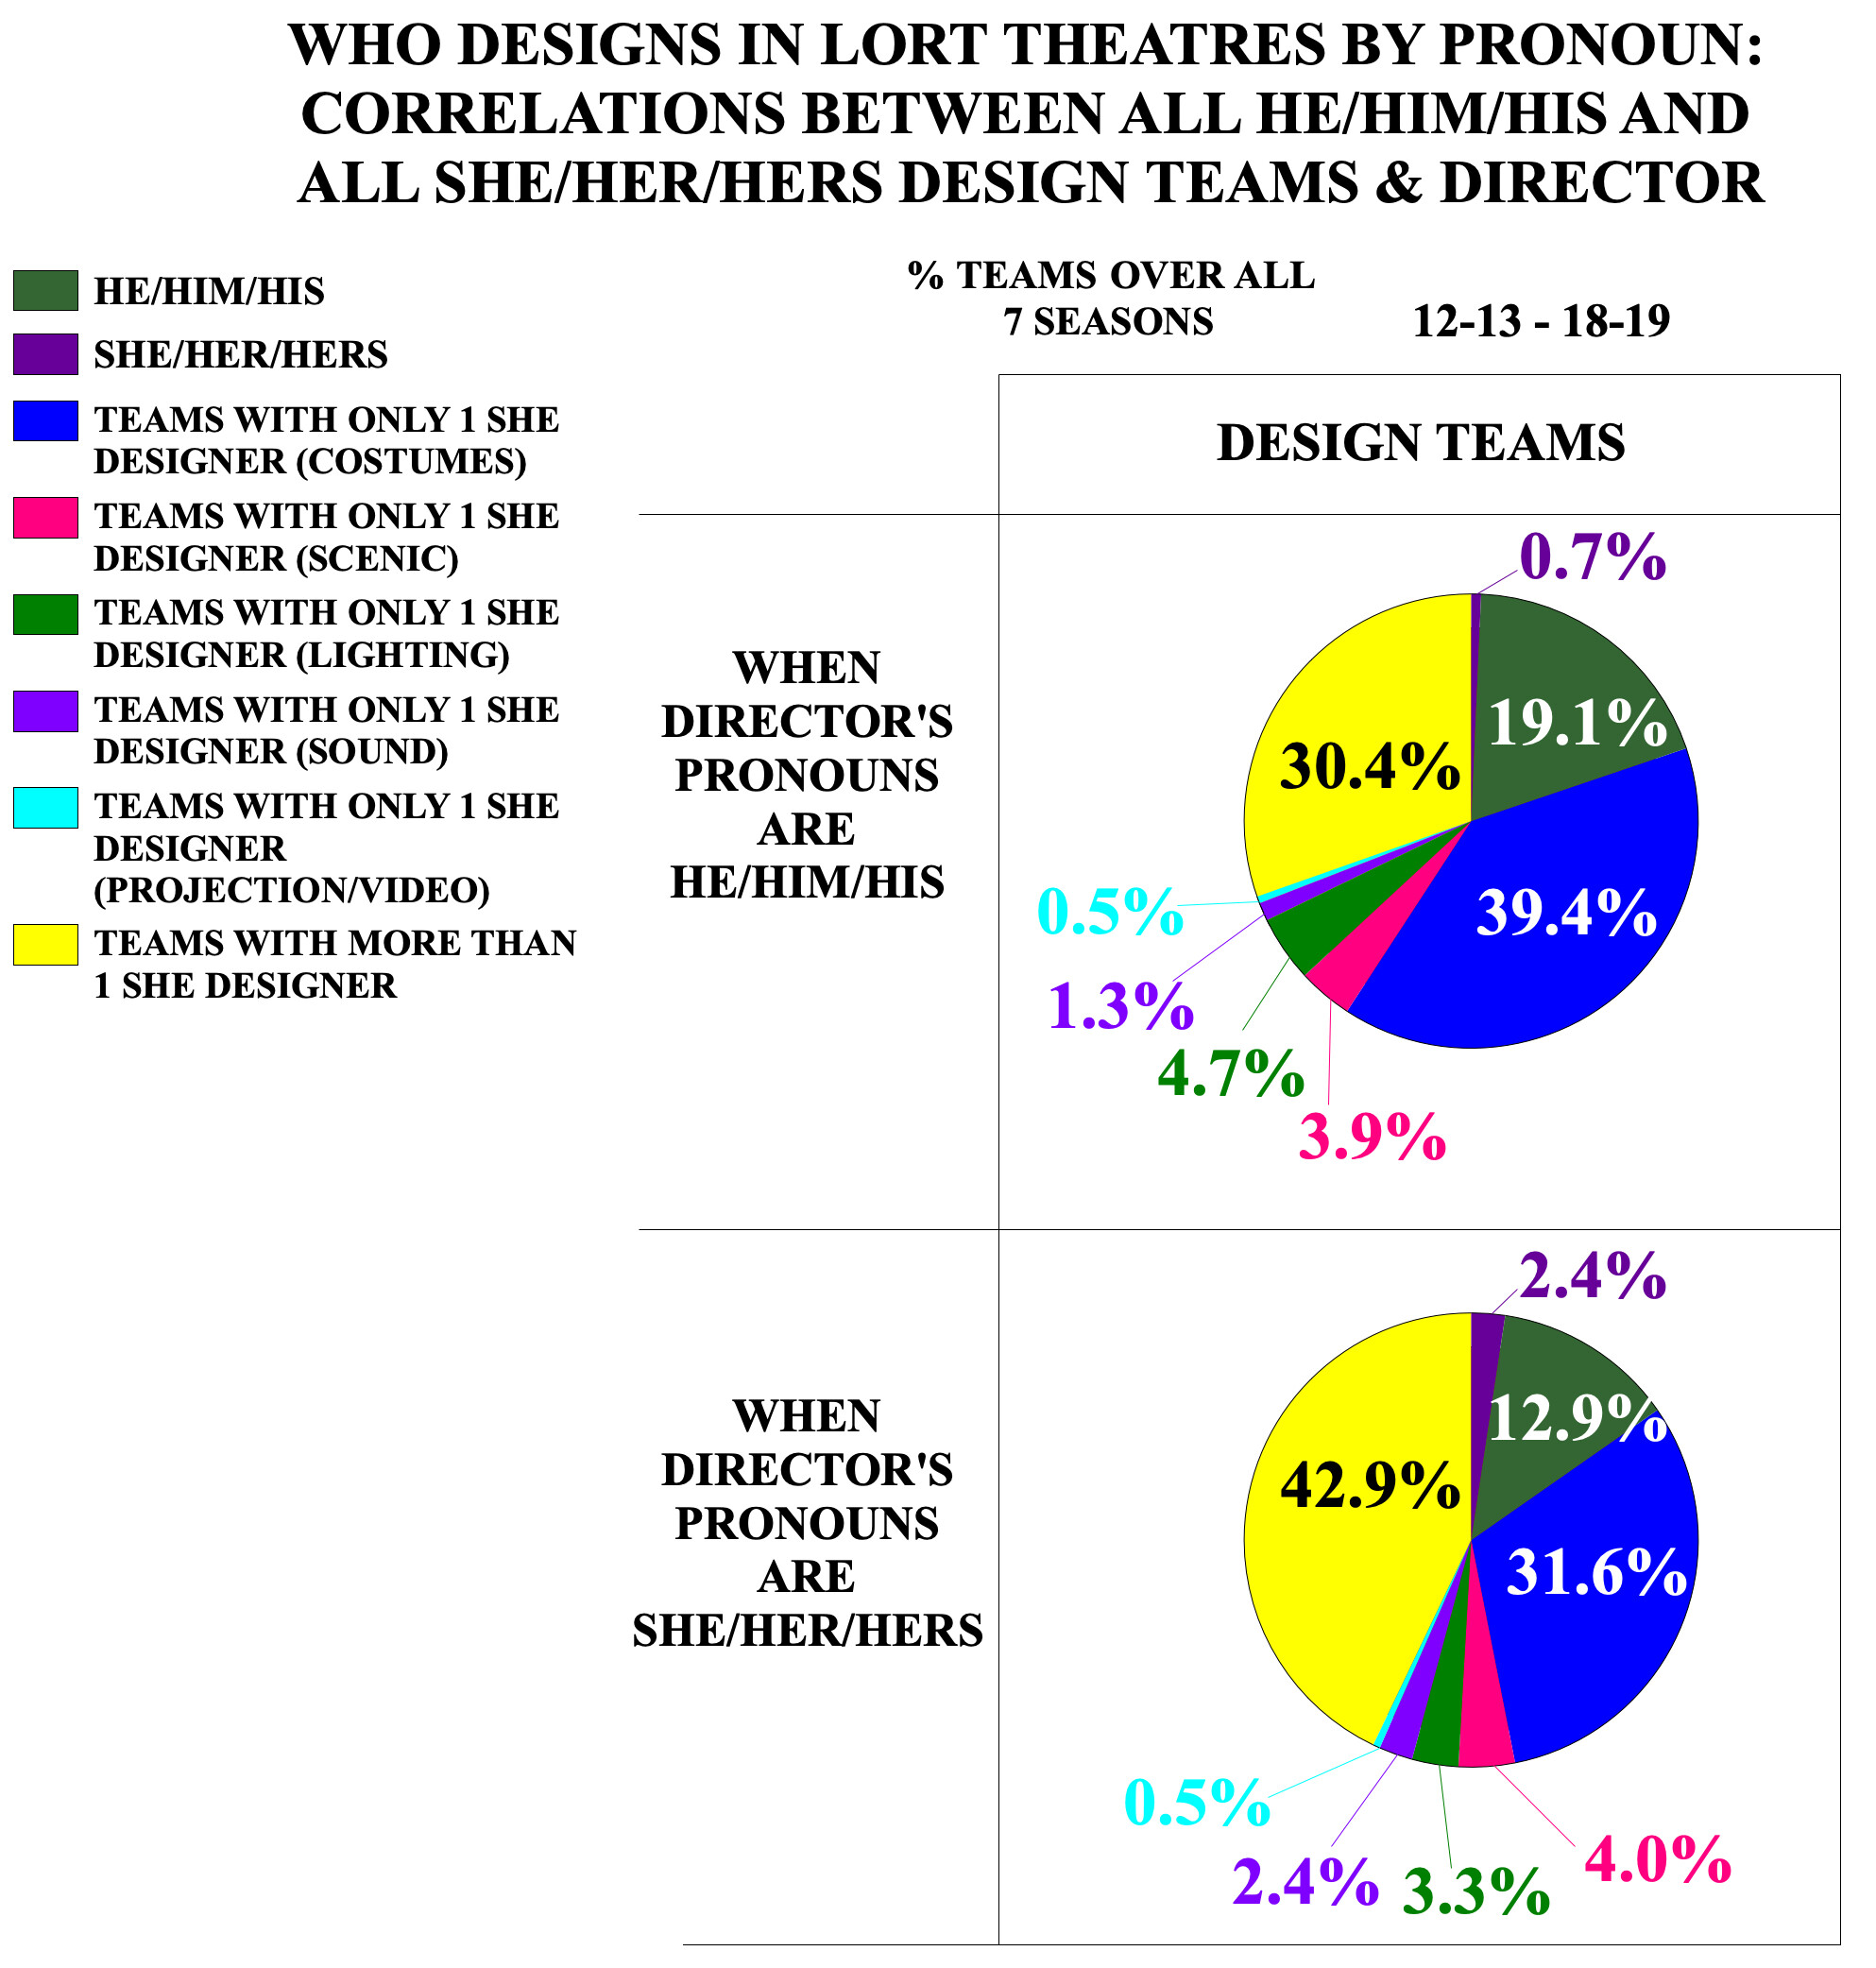
Looking at the correlations between director and designer pronouns, that story rings true, but not by as much as thought.
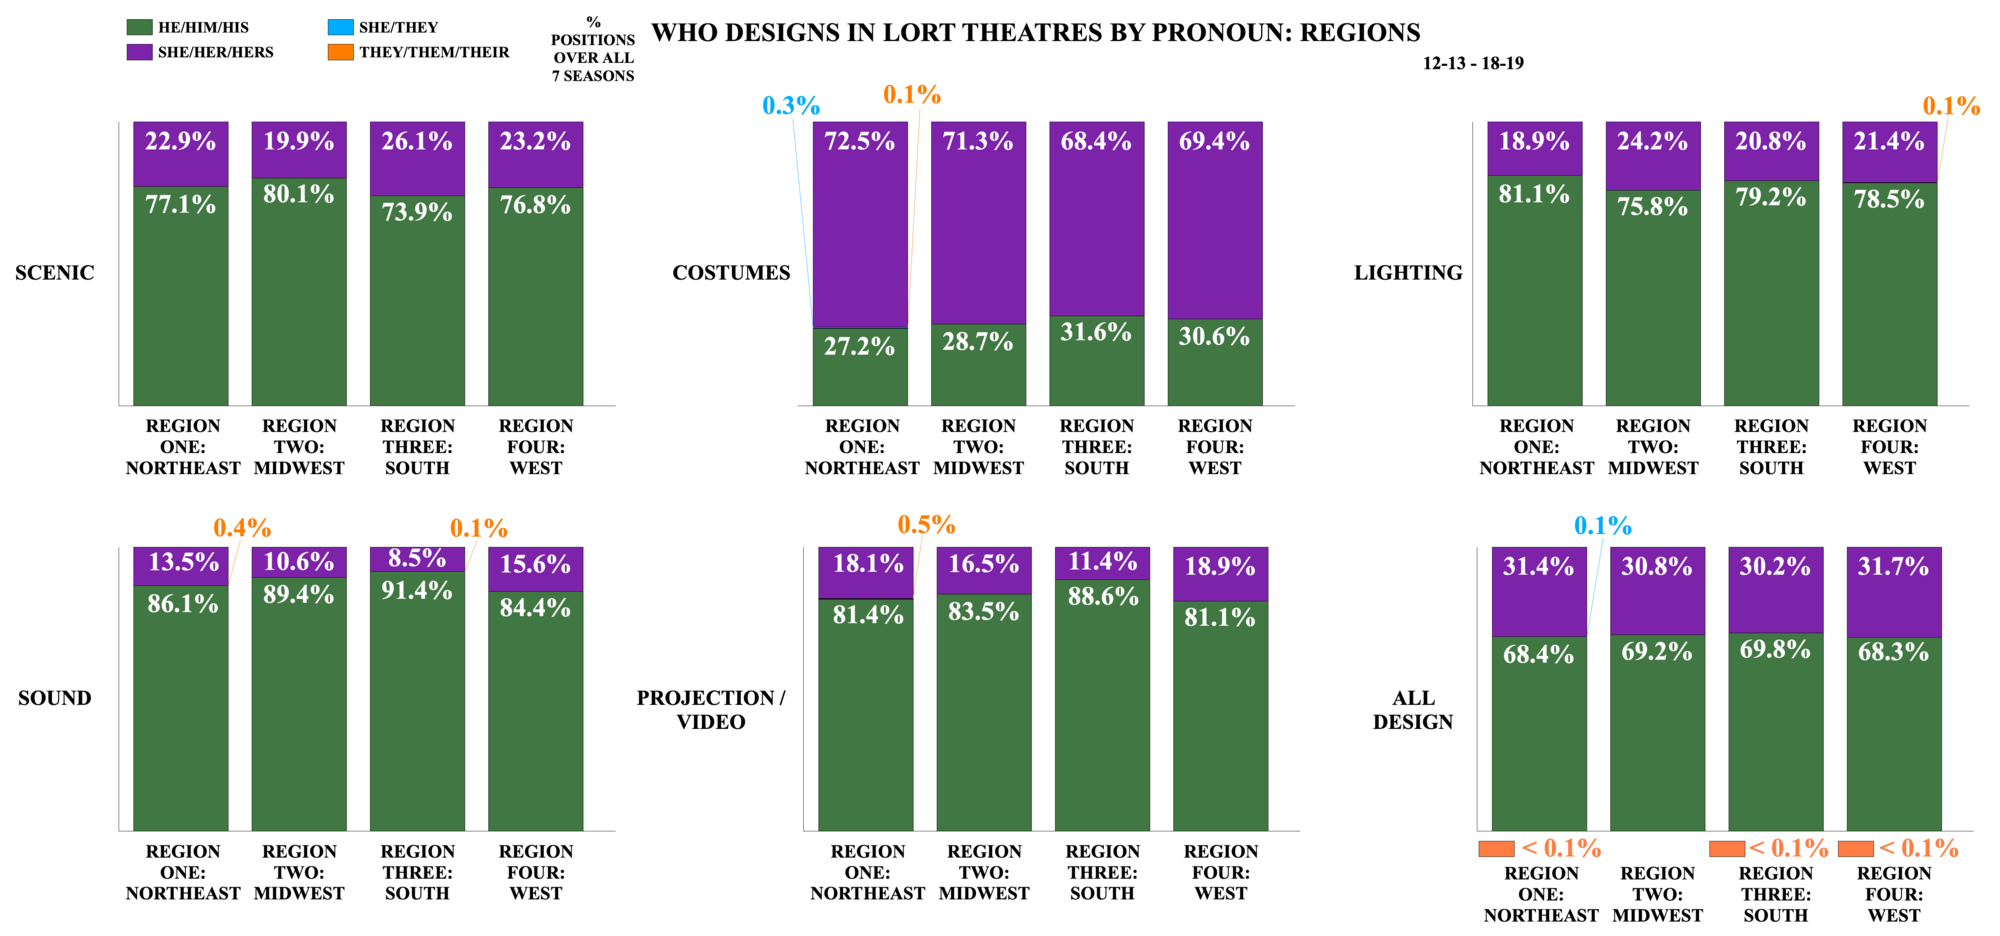
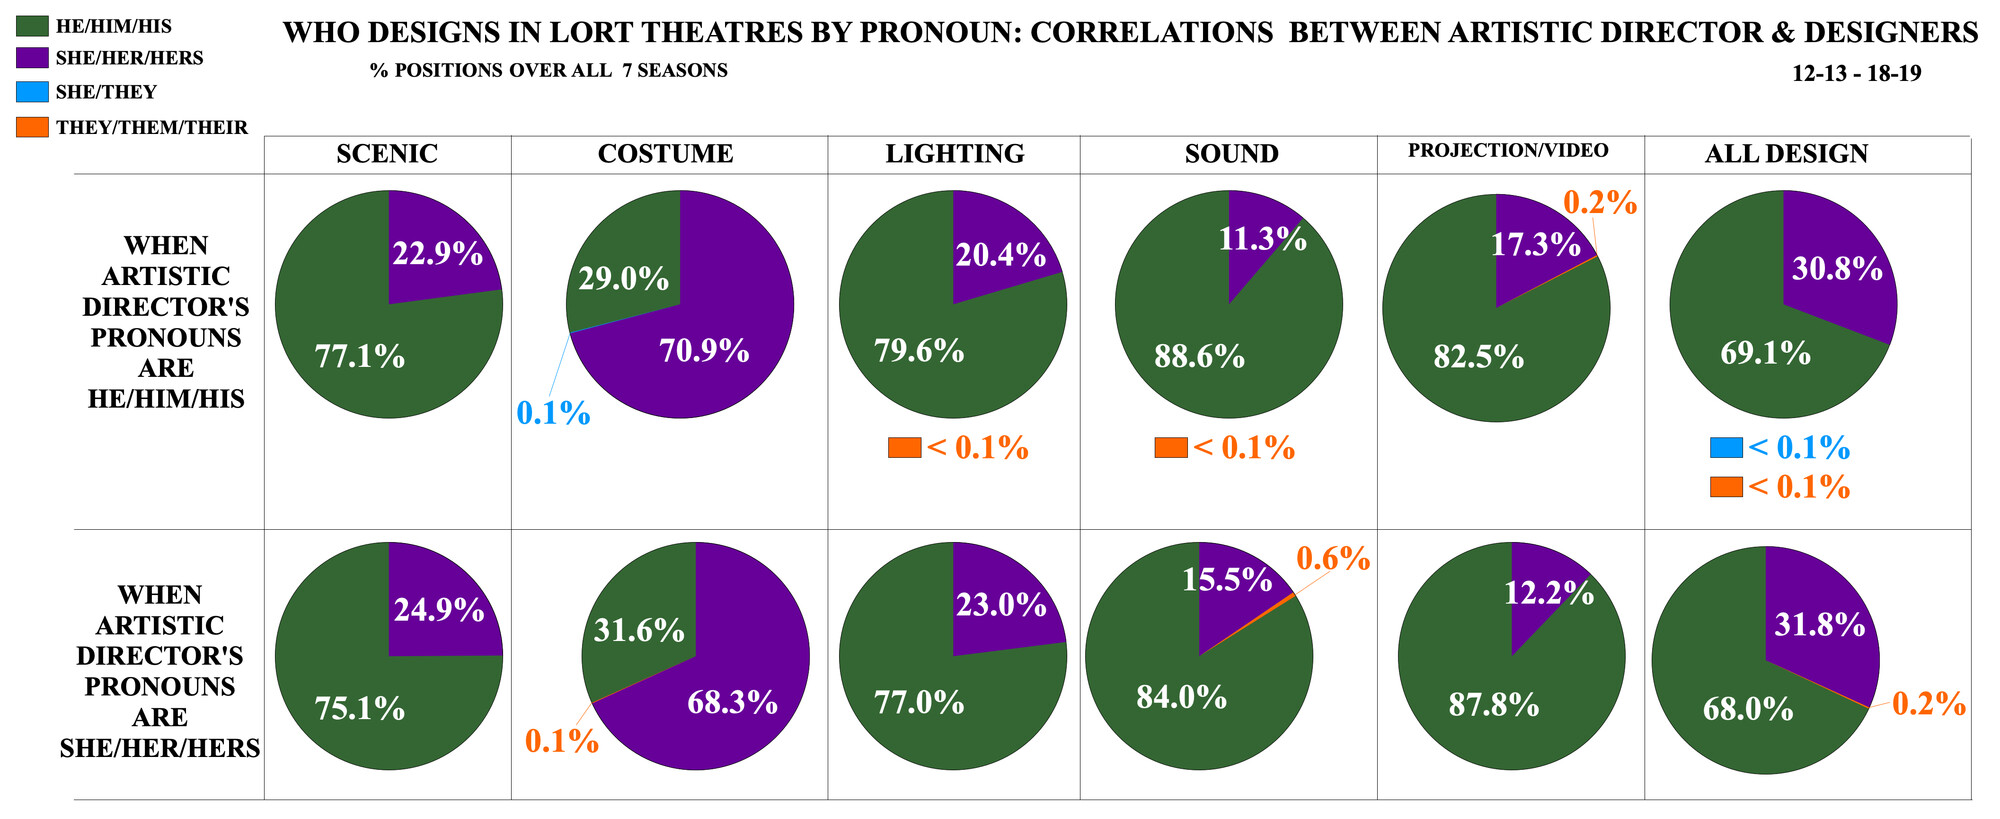
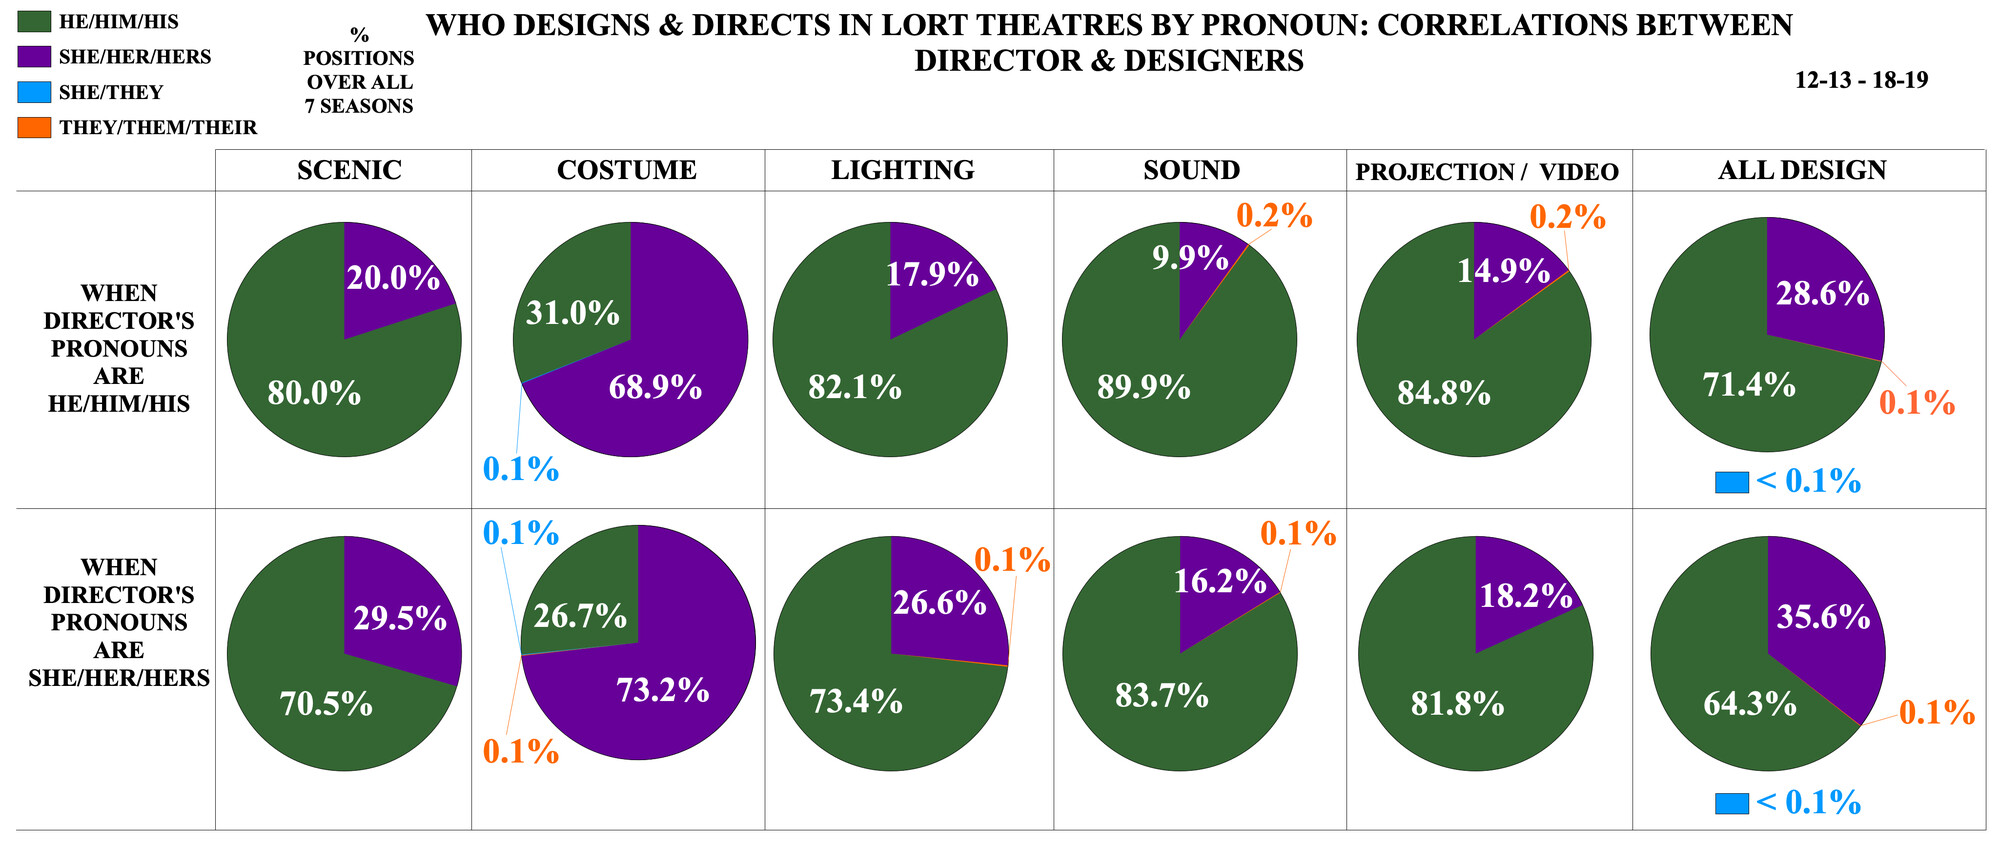
There’s a story told that when there are more she directors directing, more she designers will be designing. Looking at the correlations between director and designer pronouns, that story rings true, but not by as much as thought. She designers filled positions with she directors 9.5 percentage points more in scenic design, 4.3 percentage points more in costume design, 8.7 percentage points more in lighting design, 6.3 percentage points more in sound design, and 3.3 percentage points more in projection/video design than on teams with he directors. This results in she designers, from all design categories, filling positions 7.0 percentage points more of the time with a she director.
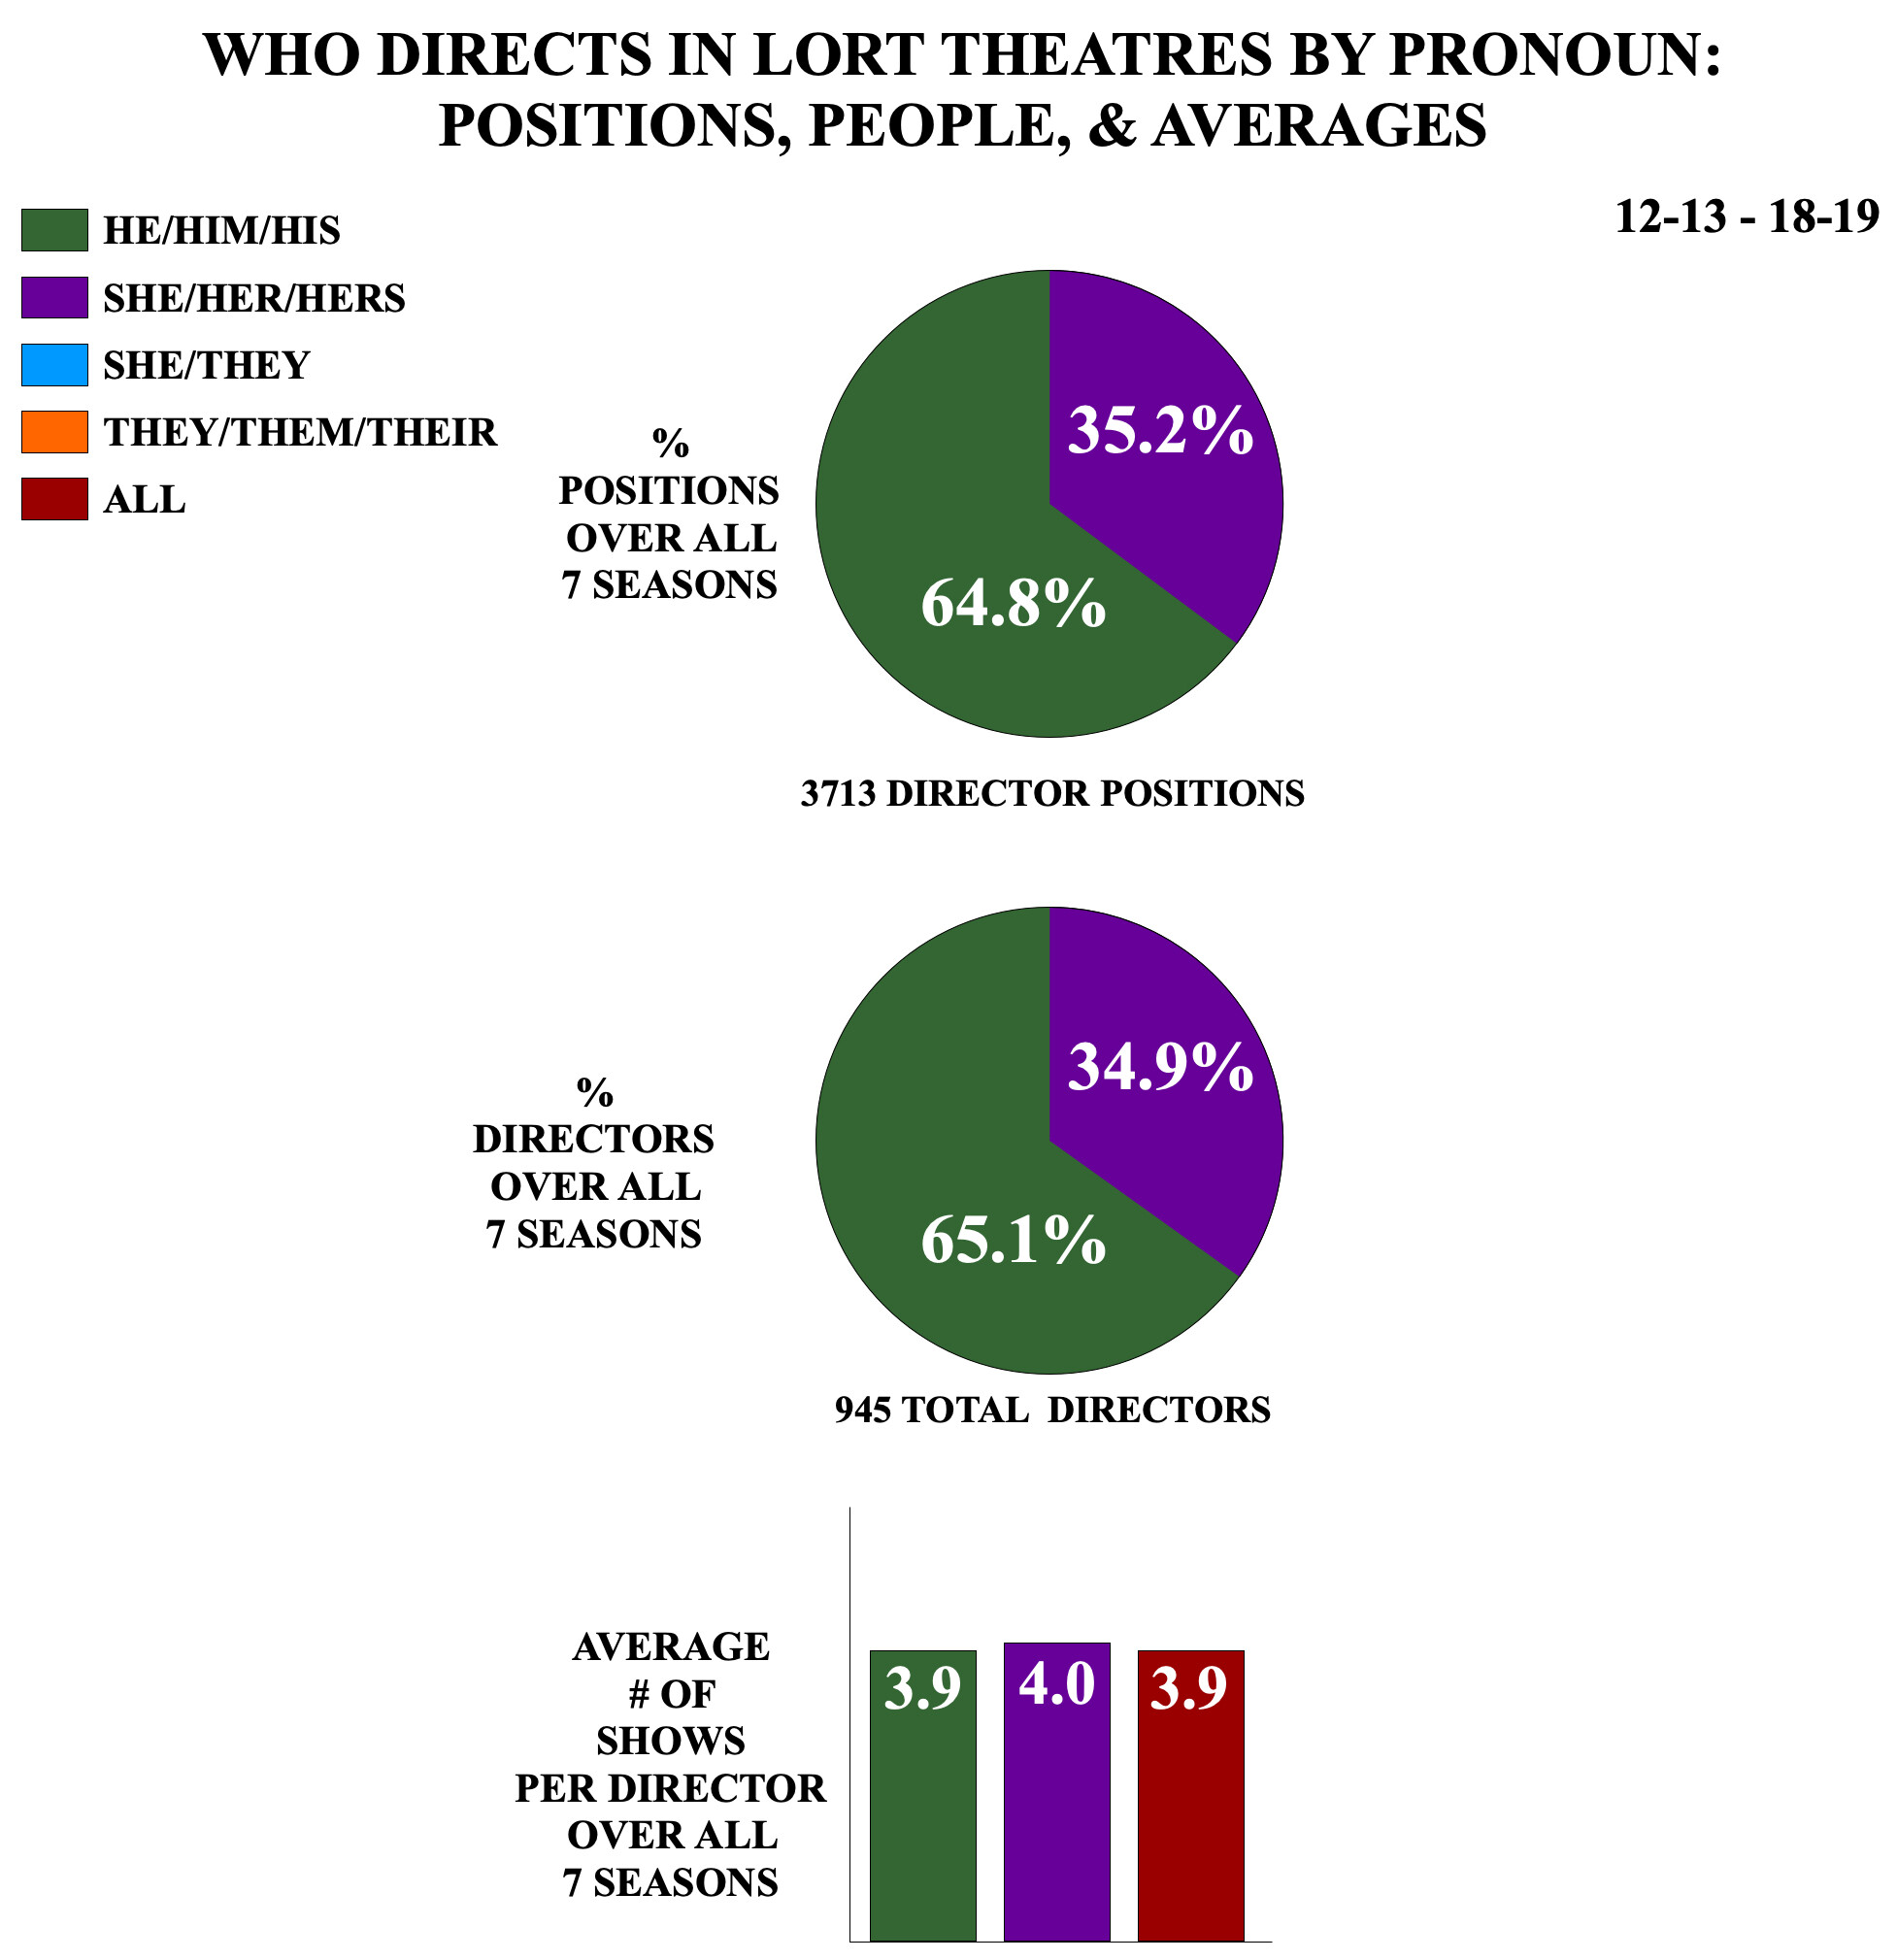
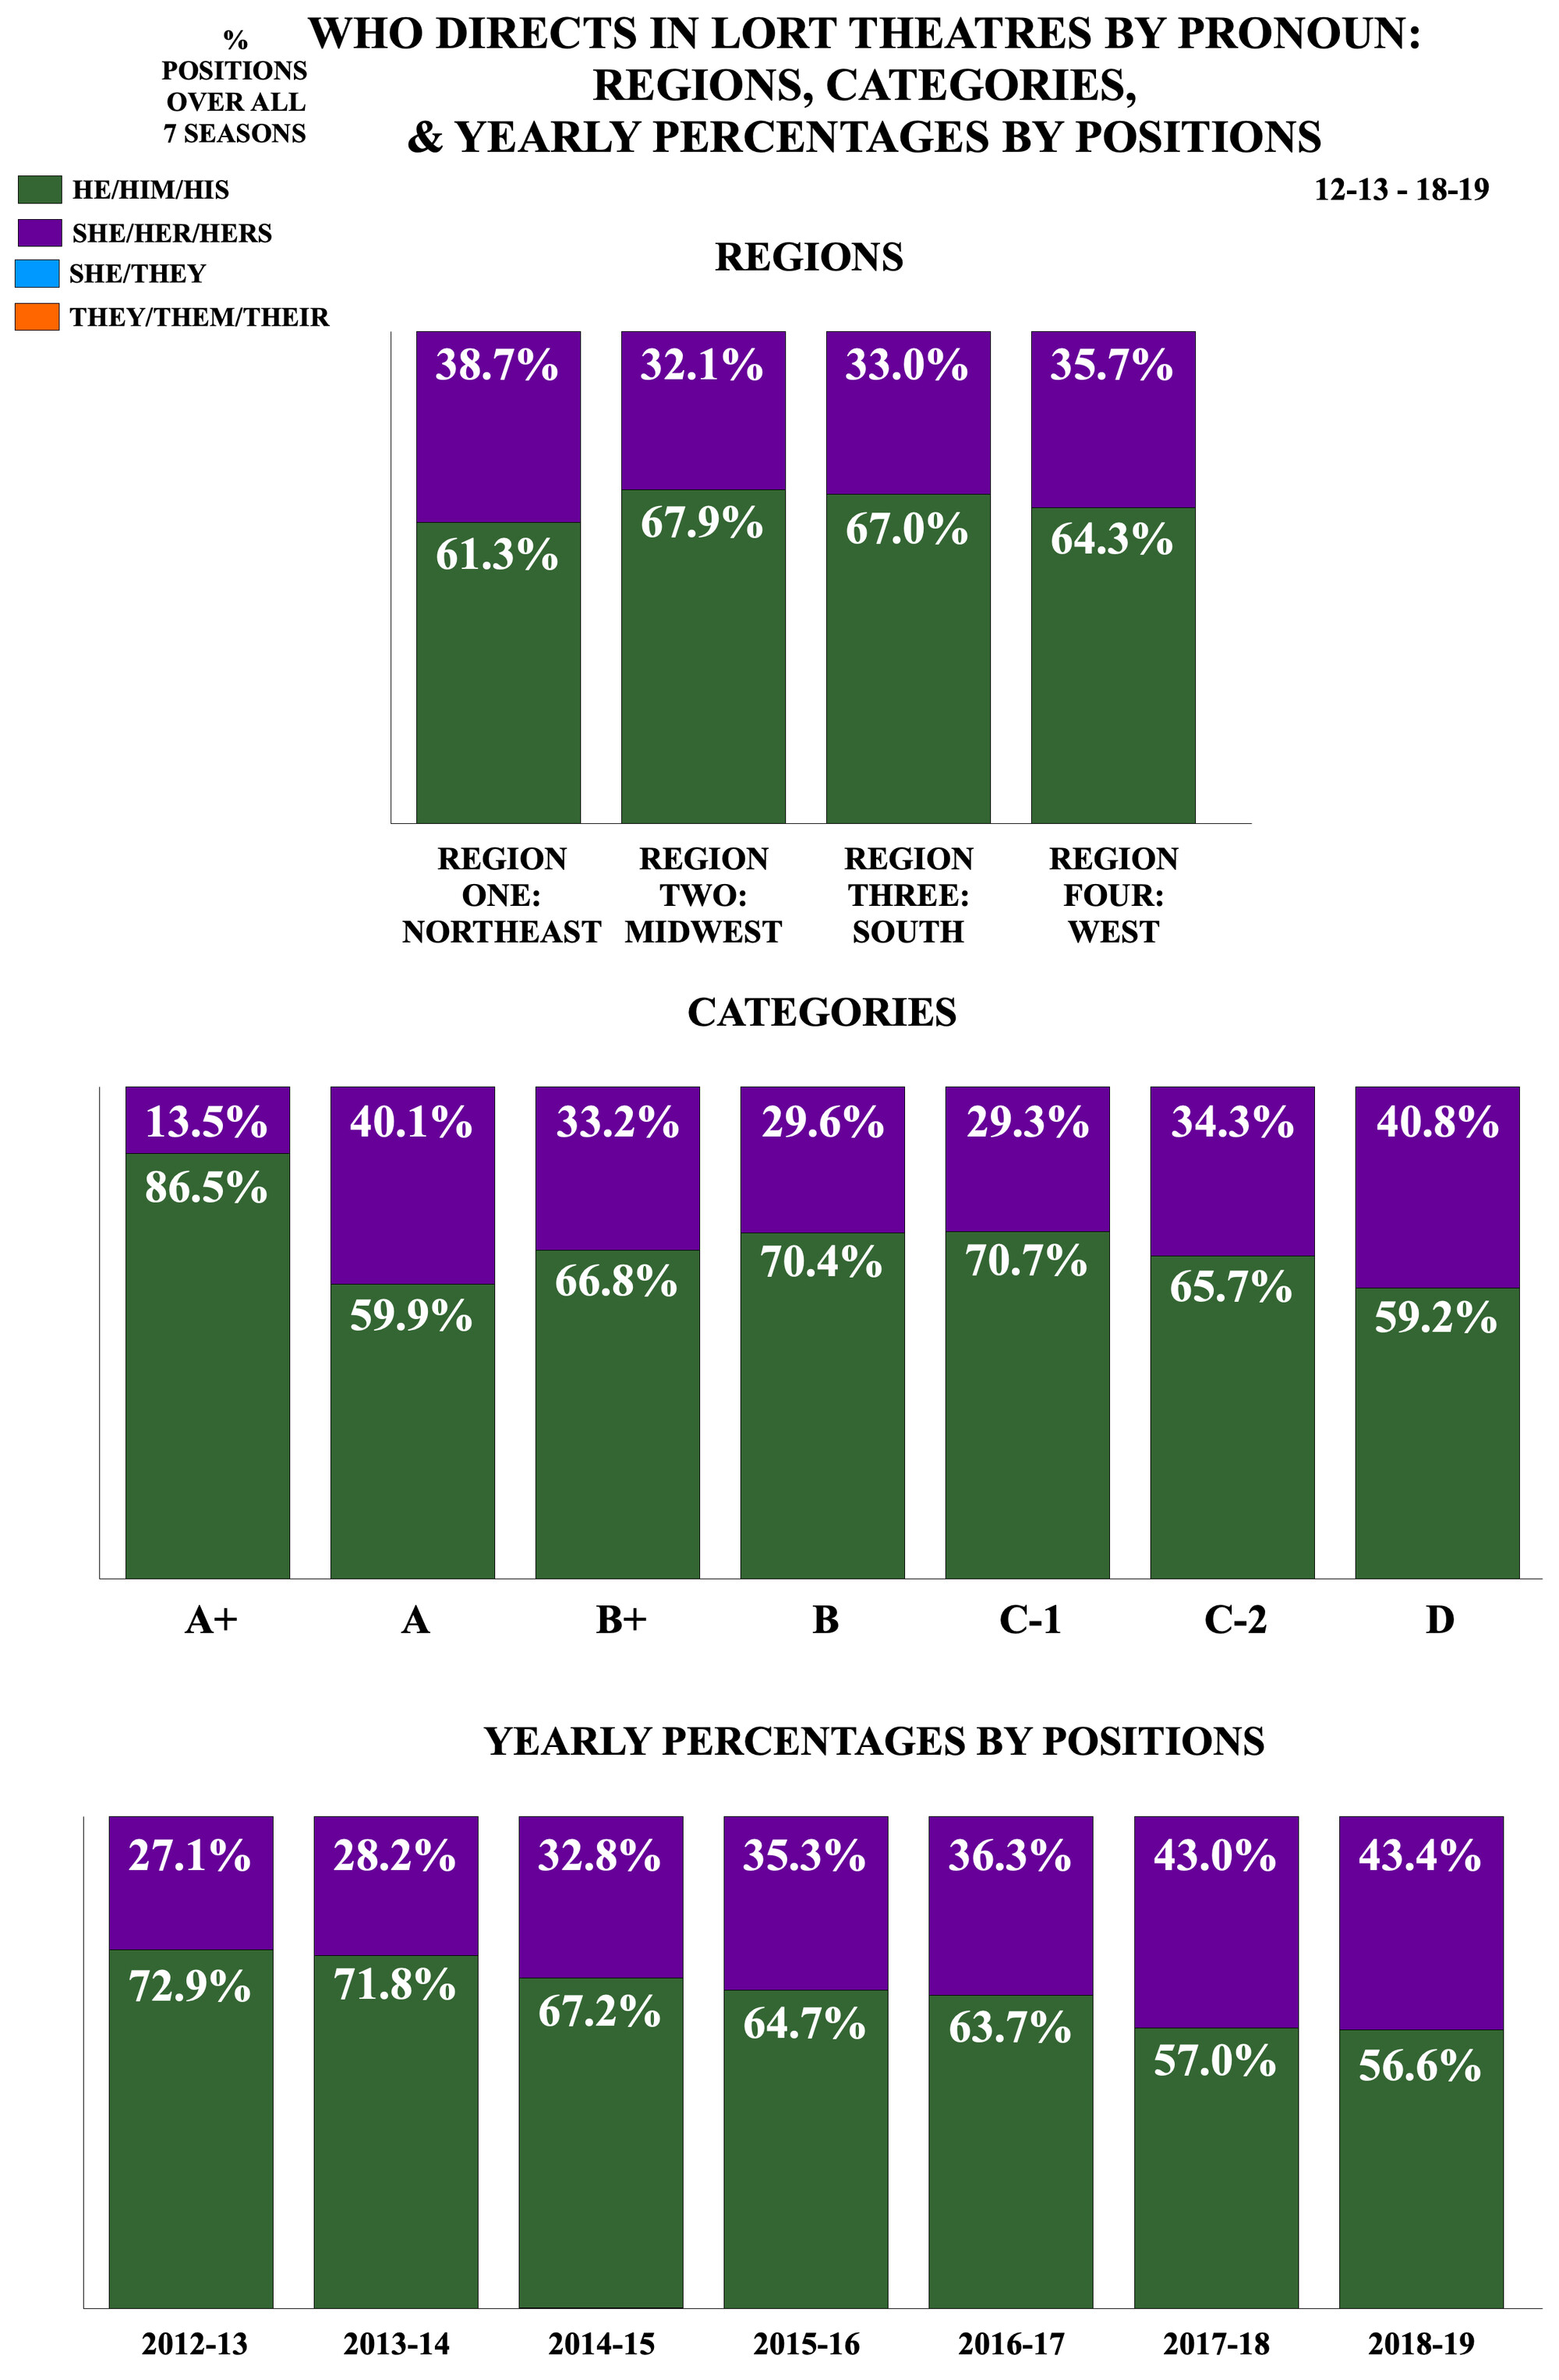
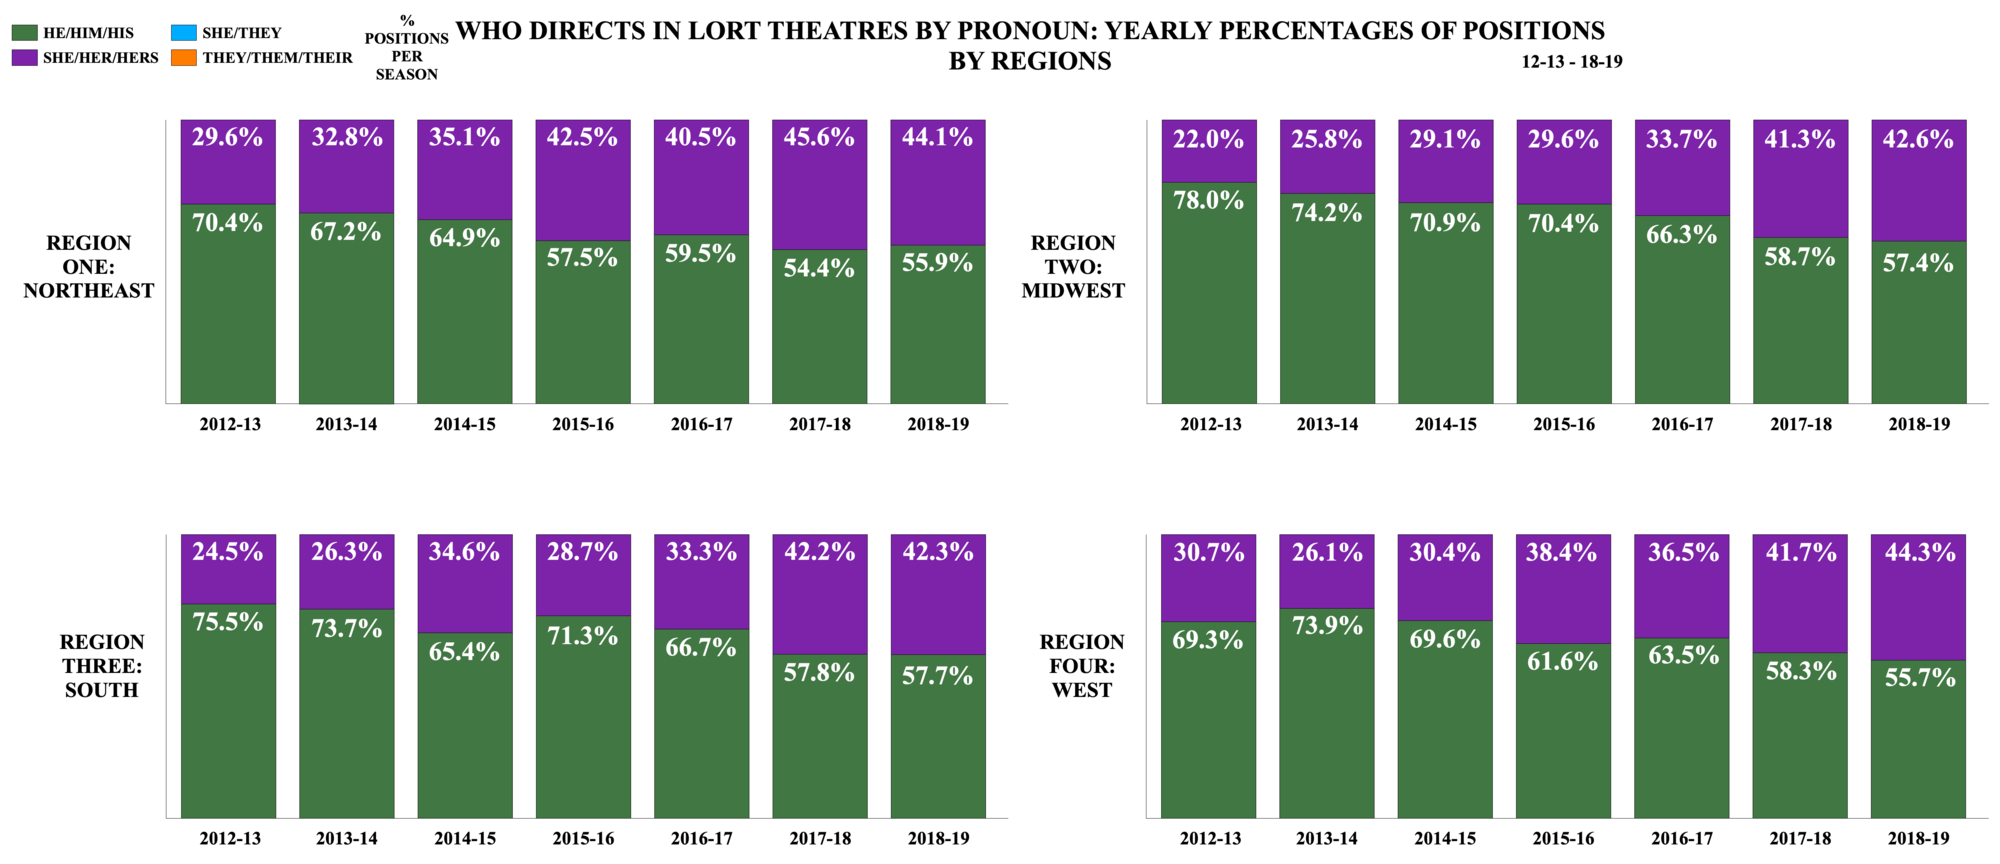
Looking at the yearly percentages of who directs, in 2018–19, 43.4 percent of directing positions were held by she directors in contrast to 27.1 percent in 2012–13, an increase of 60.1 percent.
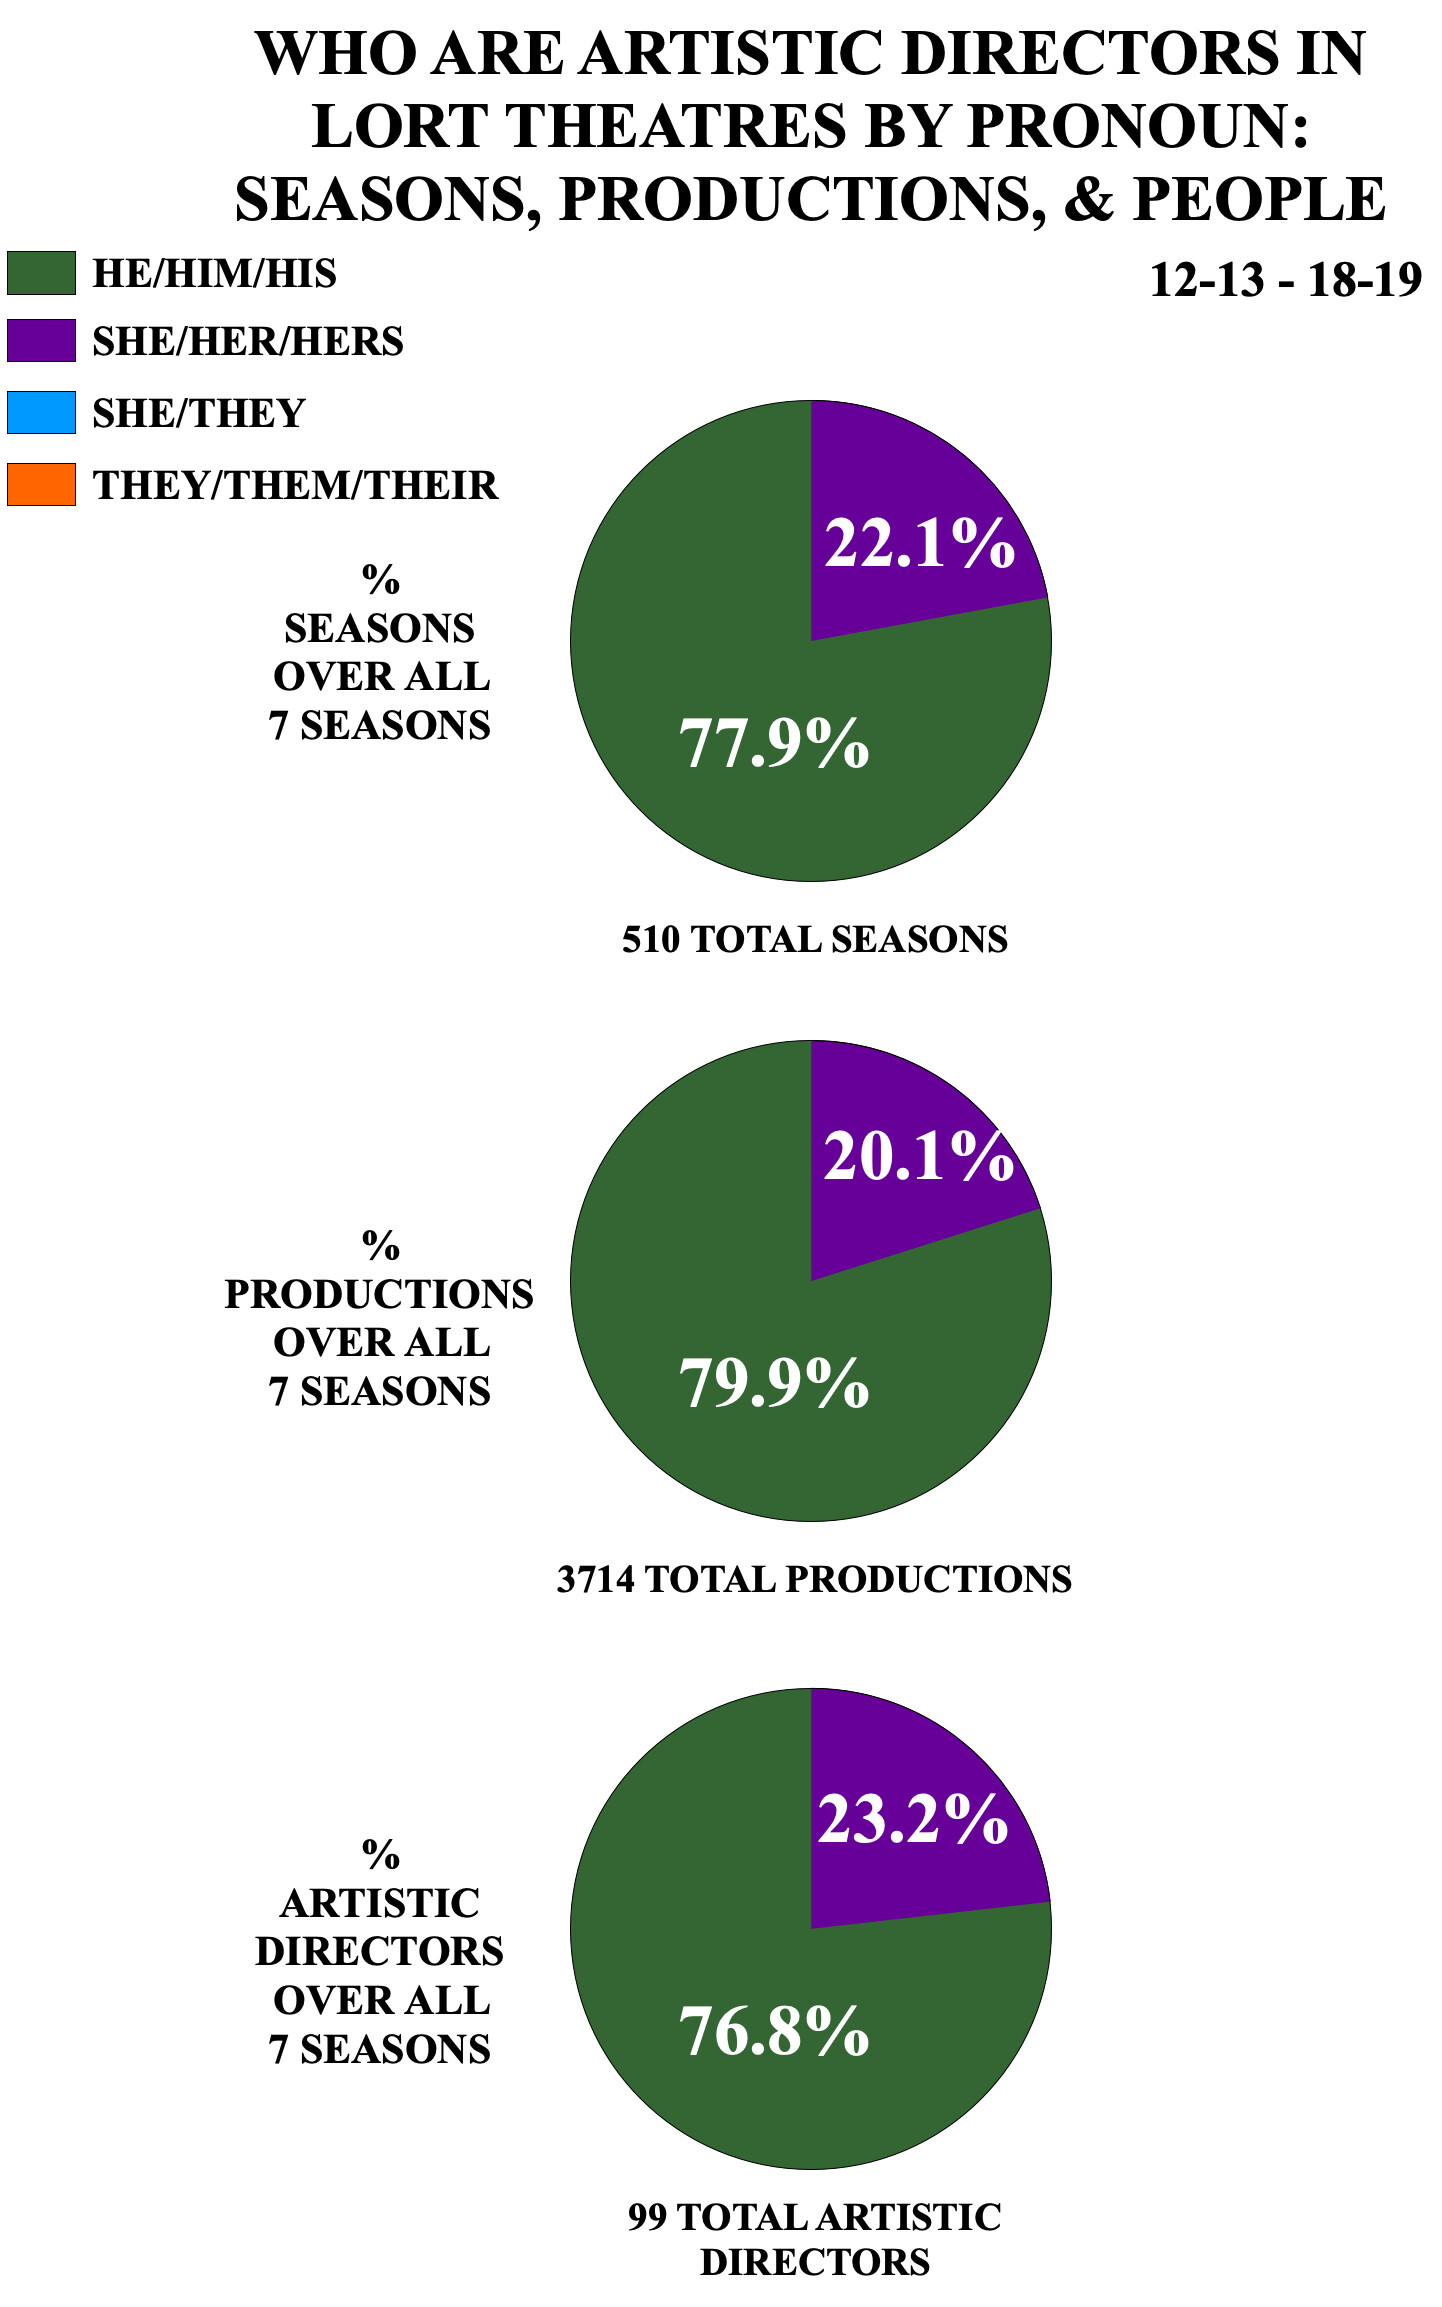
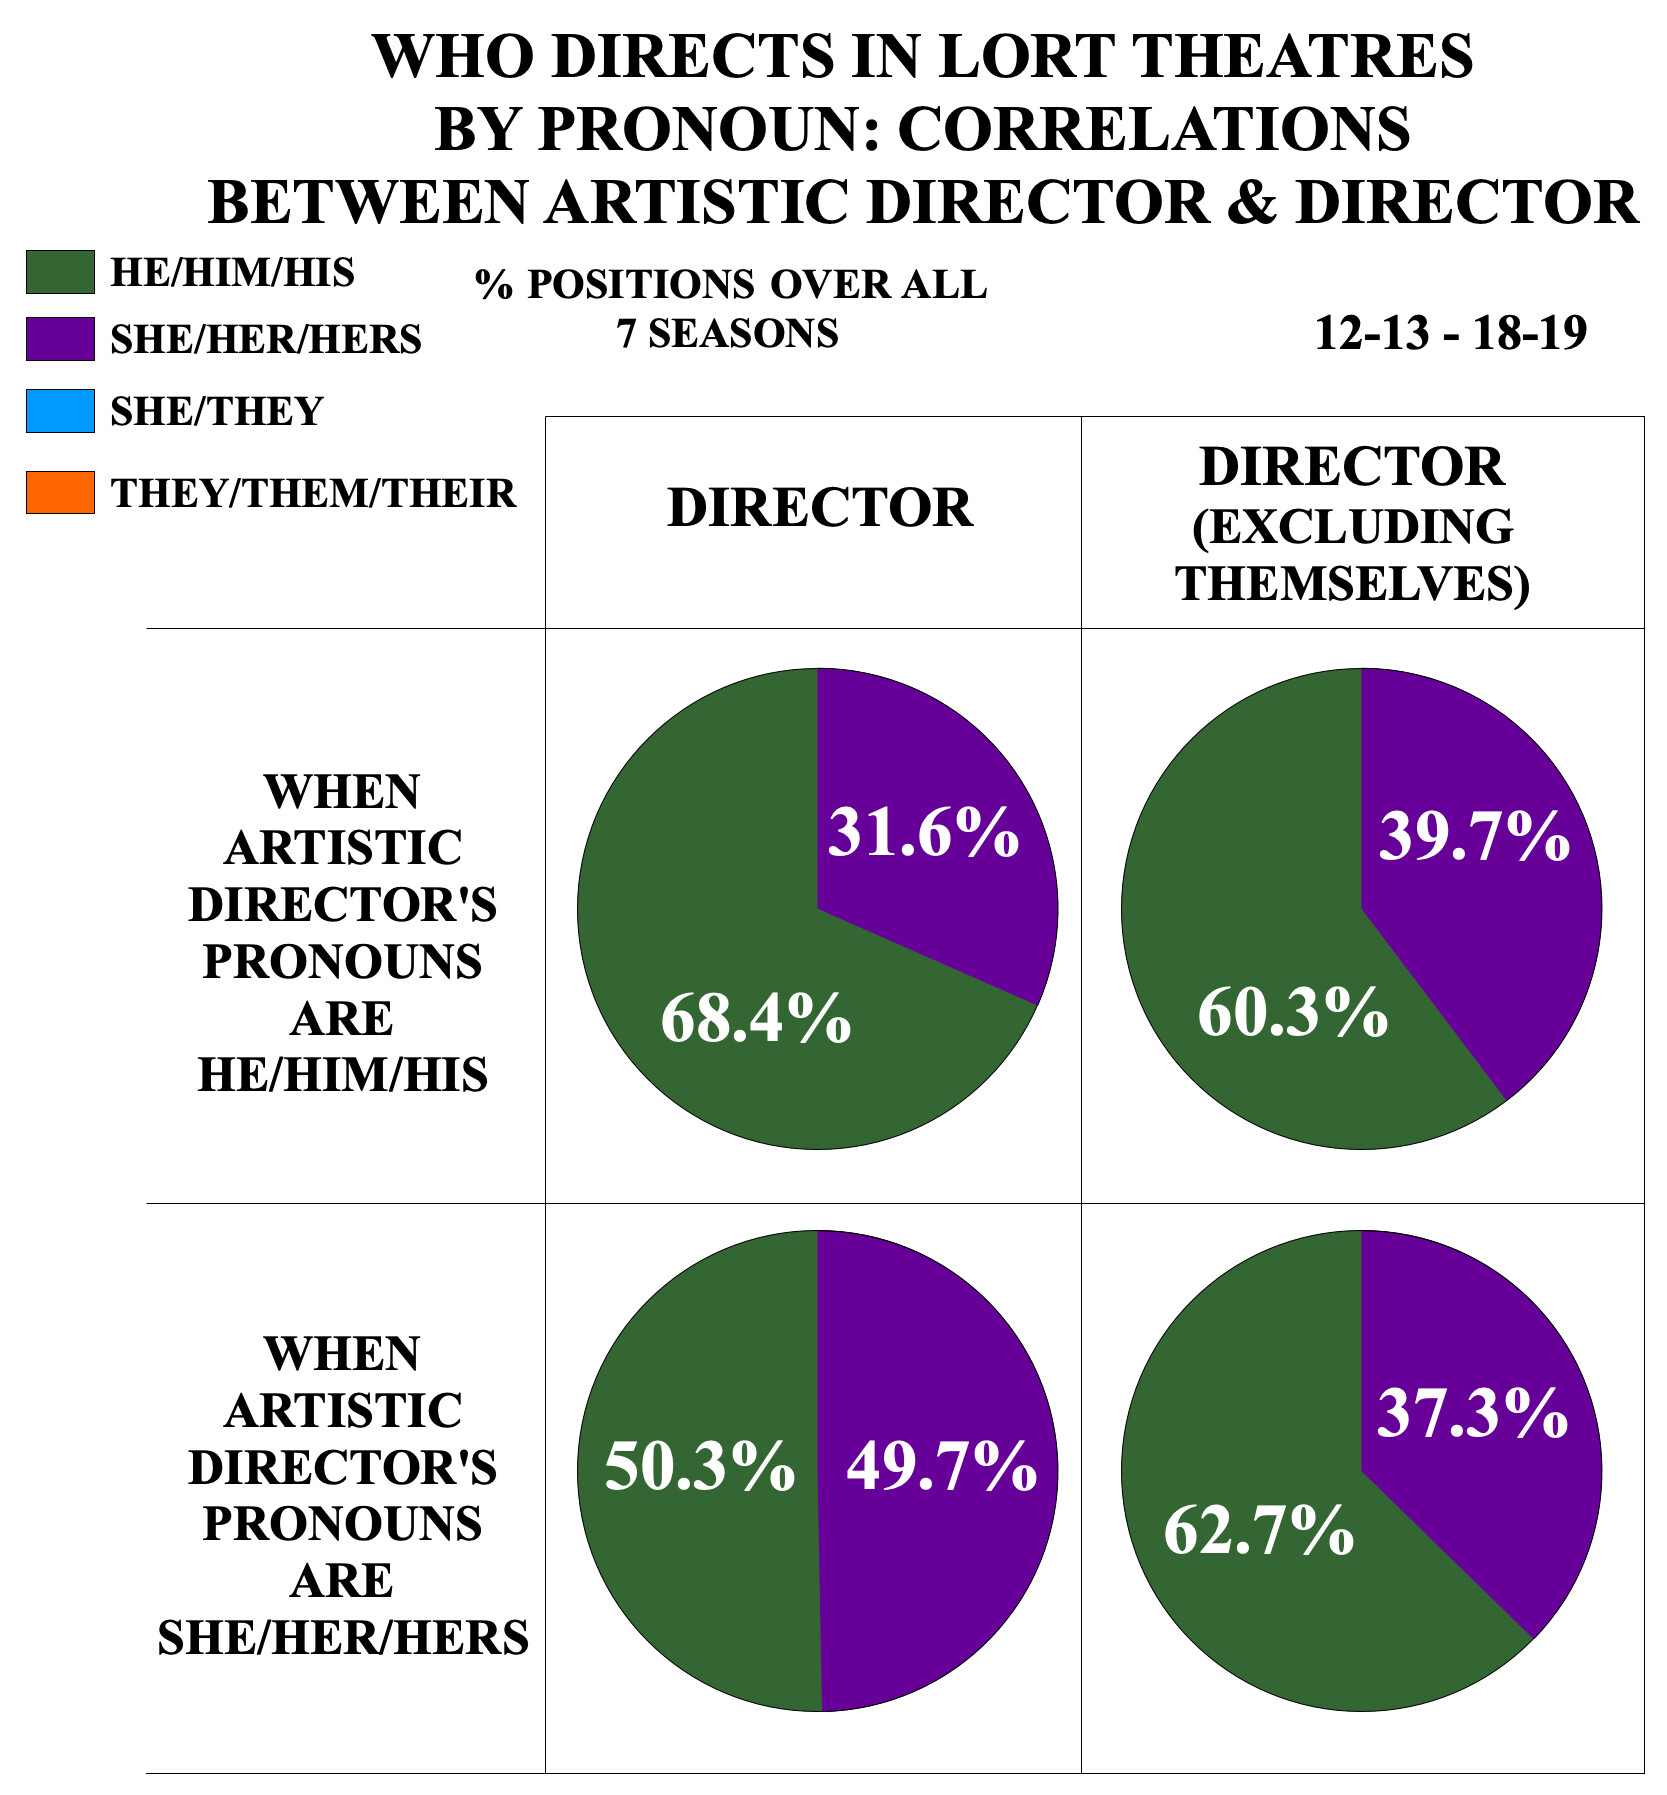
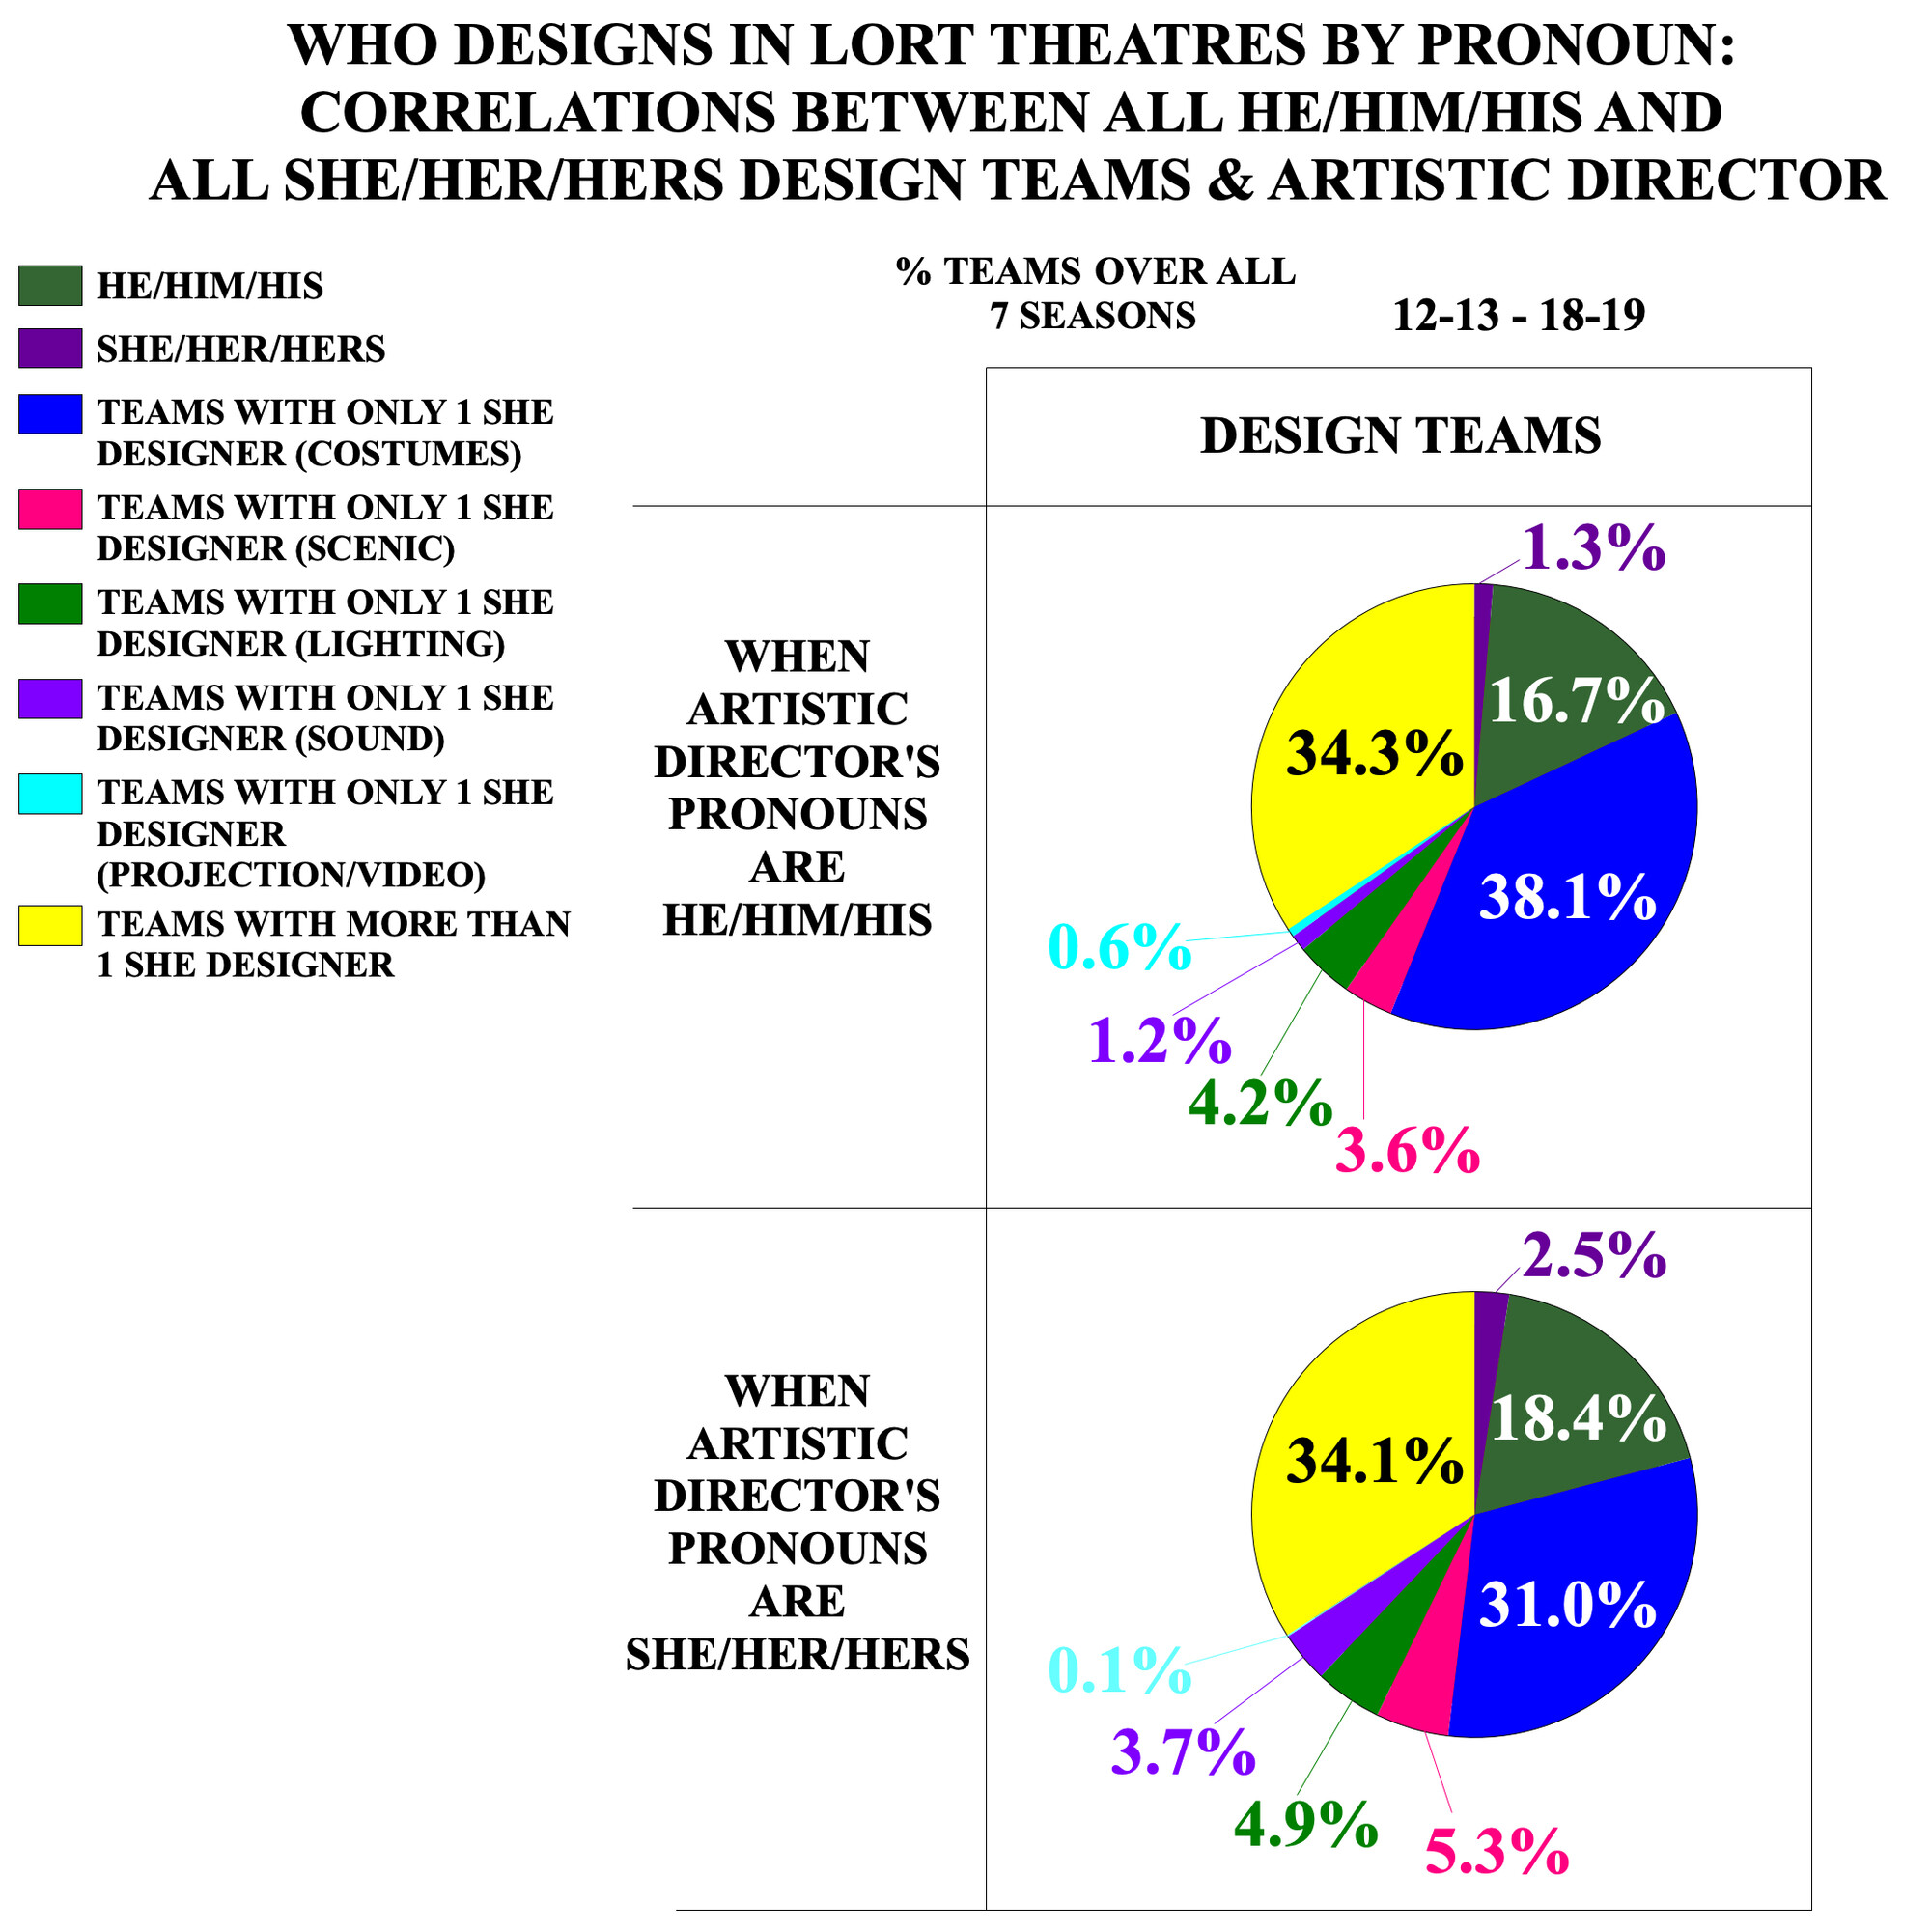
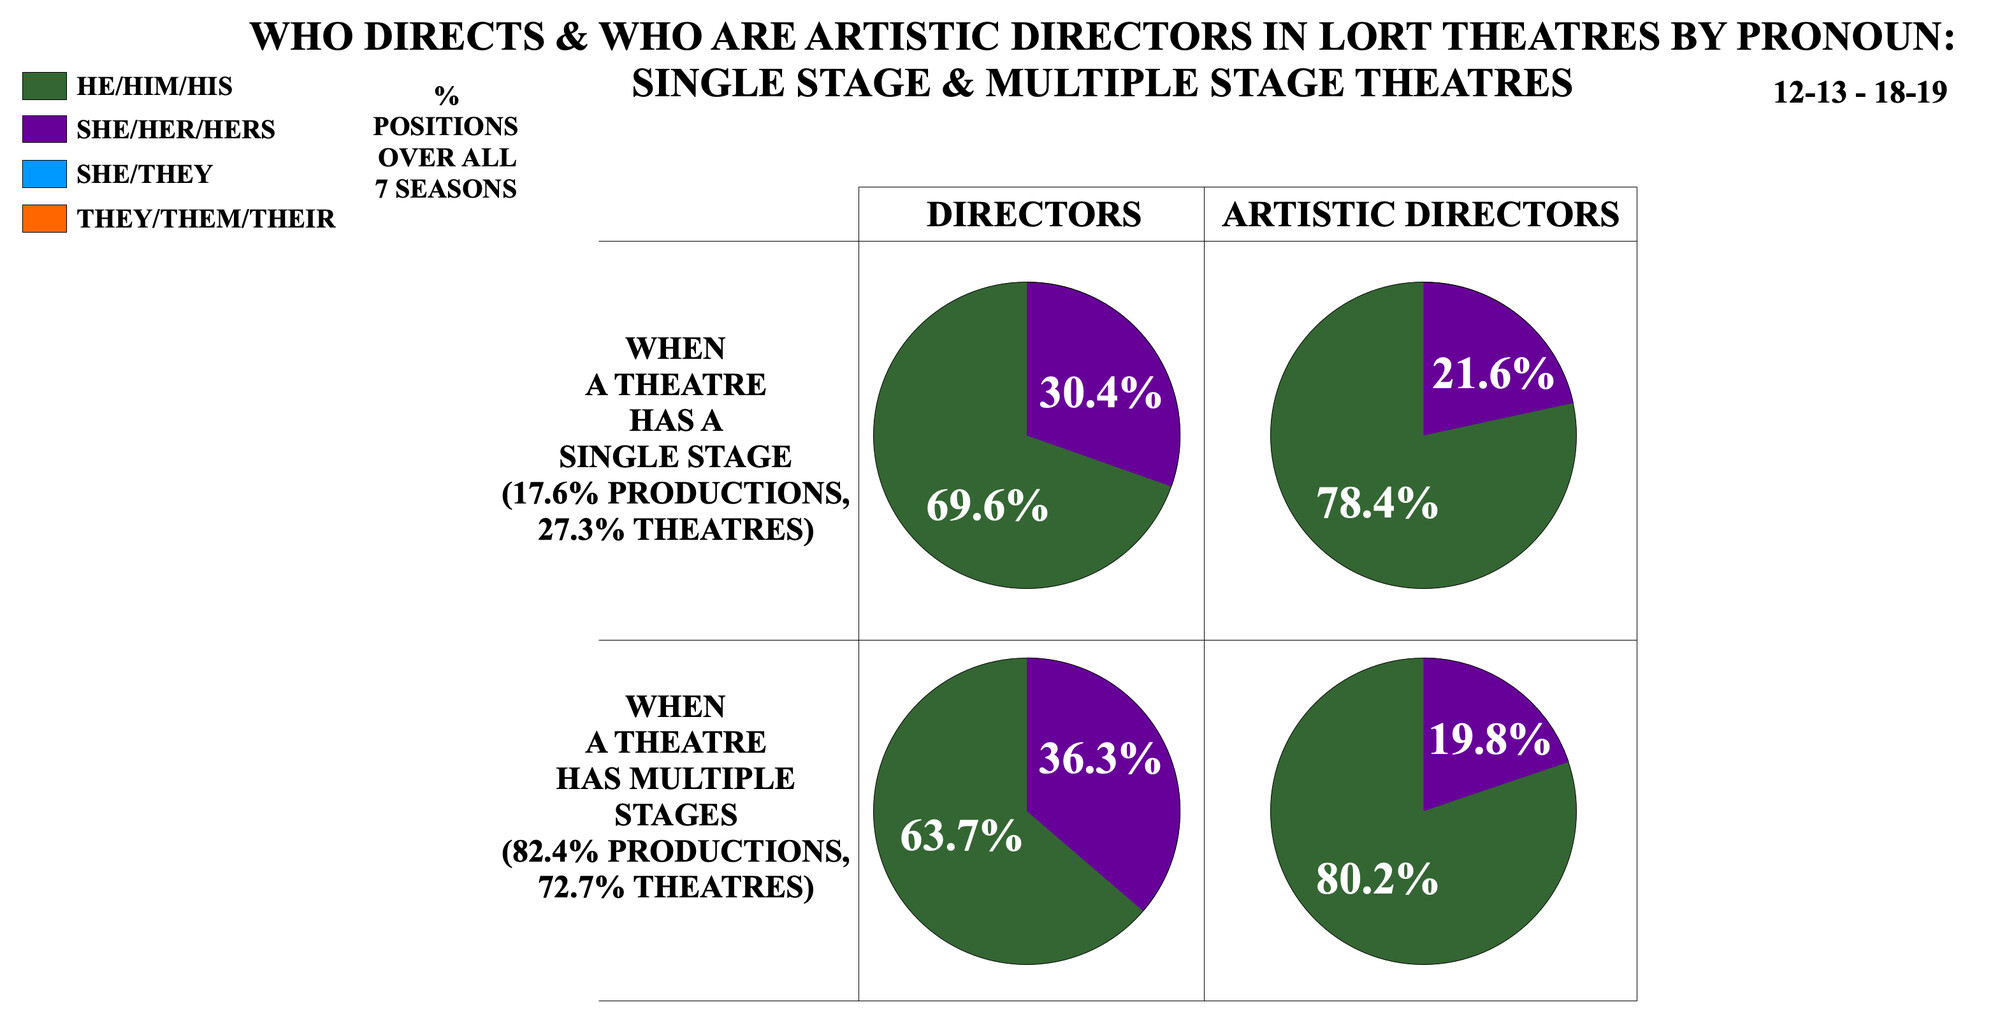
Looking at correlations between artistic director and director pronouns, percentages are nearly 50/50 between he and she directors with a she artistic director. But with a he artistic director, he directors held 68.4 percent of directing positions over the seven years studied. When productions where the artistic director is the director are excluded, percentages of who directs are much closer: roughly 60 percent he directors and 40 percent she directors under both he and she artistic directors.
Reflections and How We Move Forward
This year, my already strained faith in the national theatre field has been tested. Most designers, just like most artists in the field, have no work right now. They are hanging on by their fingertips. They have been forgotten or ignored by most of the theatres that called themselves “artistic homes” for the artists. Many theatre designers I know are considering leaving the theatre—not just until it comes back, but forever—or have already left for good. Space needs to be made for designers to not just be guests passing through but to be a part of the heart of a theatre.
In the past, I’ve written about how the theatre field can move forward, how it can increase diversity and access, and how it can practice equity and inclusion and justice when it comes to the hiring of designers. But perhaps I should’ve also been writing about how important it is to support designers once they’ve been hired; how practices like ten-out-of-twelves drive people out of the industry, sometimes before they’ve really begun; how not having clear pathways to report abuse of all kinds particularly hurts freelance theatre artists.
I don’t know what theatre will look like after this moment of the pandemic and long-overdue racial reckoning. I fear only the most traditionally successful designers will be invited back to work. I fear all the recent momentum and energy towards supporting designers of the global majority will evaporate in the face of self-interest and the status quo. I fear the surge towards equity and justice will fade away and money, as always, will be the deciding factor.
But actions help with the fear. Last summer, I launched a survey to gather self-identified demographic information from LORT designers and directors with the hope of putting out more reports. I’m particularly excited to look at race and ethnicity demographics, as I’ve been struggling with how to do that ethically since the study began six years ago. Take the survey here.
It is my hope that one day my study will be unnecessary, that all theatres will hire designers and directors through an equity lens and create working environments where everyone is heard, seen, and appreciated in the fullness of their humanity.
If you work at one of these theatres and would like your company’s specific raw data, please write me at [email protected] from your institutional email, and I’ll happily send it to you. Please allow a week for a response. If you work at a LORT theatre and would like to confirm data in the future, please send me an email from your institutional email.





Comments
The article is just the start of the conversation—we want to know what you think about this subject, too! HowlRound is a space for knowledge-sharing, and we welcome spirited, thoughtful, and on-topic dialogue. Find our full comments policy here
There's a math error in the very first chart. It's actually 70.4% she designs in costume design. It'll be updated after the holidays.