
We've reached the end of this year's study! As I crunched the numbers this year, I was struck by how every hiring decision matters, not just to the individual hired, but to the theatre doing the hiring. Every hiring choice is a chance for theatres to show and live the values they espouse in their mission statements. I hope the statistics over the past few years have been thought-provoking and illuminating. I've tried not to be too opinionated in my presentation of them, but I feel strongly that the lack of members of traditionally marginalized communities as designers, directors, and artistic directors is not simply a pipeline issue that time will magically solve. Theatremakers from traditionally marginalized and underrepresented communities already exist, and are ready and more than qualified to work on shows, both ones that tell part of their own stories and ones that don’t. This issue requires conscious, corrective action now, before we lose more artists.
Who Designs and Directs in LORT Theatres by Gender
Phase Four: Part 4
Want to read the whole report?
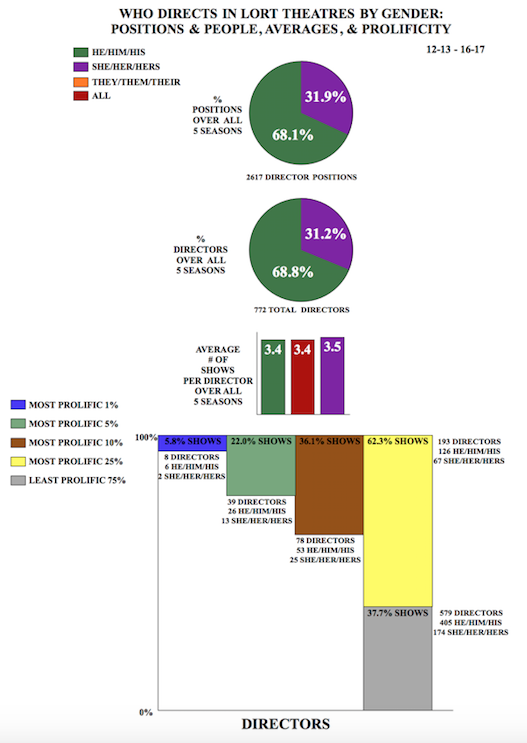
Who Directs in LORT Theatres by Gender: Positions and People, Averages, and Prolificity

Of the 2617 director positions over the five years examined, 68.1 percent were filled by he directors, and 31.9 percent were filled by she directors. Of the 772 directors, 68.8 percent were he directors, and 31.2 percent were she directors. Over the five seasons, directors averaged 3.4 shows, with he designers averaging 3.4 shows, and she directors averaging 3.5 shows.
The most prolific 1 percent of directors directed 5.8 percent of all shows with a director, and is comprised of eight directors, with six he directors and two she directors. These eight directors did 152 shows over the five seasons. The most prolific 5 percent directed 22.0 percent of shows with a director, and is comprised of thirty-nine directors, with twenty-six (66.7 percent of the most prolific 5 percent) he directors, and thirteen (33.3 percent of the most prolific 5 percent) she directors. The most prolific 10 percent directed 36.1 percent of all shows with a director, and is comprised of 78 directors, with fifty-three (67.9 percent of the most prolific 10 percent) he directors, and twenty-five (32.1 percent of the most prolific 10 percent) she directors. The most prolific 25 percent directed 62.3 percent of all shows with a director, comprised of 193 directors, with 126 (65.3 percent of the most prolific 25 percent) he directors, being 23.7 percent of all he directors, and 67 (34.7 percent of the most prolific 25 percent) she directors, being 27.8 percent of all she directors. The least prolific 75 percent directed 37.7 percent of shows, and is comprised of 579 directors, with 405 (69.9 percent of the least prolific 75 percent) he directors, and 174 (30.1 percent of the least prolific 75 percent) she directors.
Who Directs in LORT Theatres: Regions & Categories, Yearly Percentages by Positions

The following statistics are percentages per the four Census regions of the United States over all five seasons examined. Region one is the Northeast, region two is the Midwest, region three is the South, and region four is the West. For details on which states are considered to be in which regions, visit the Census Bureau.
In direction, 63.8 percent of all positions were filled by he directors, and 36.2 percent were filled by she directors in region one. 71.9 percent of positions were filled by he directors, and 28.1 percent were filled by she directors in region two. In region three, 70.6 percent of positions were filled by he directors, and 29.4 percent were filled by she directors. 67.4 percent of positions were filled by he directors, and 32.6 percent were filled by she directors in region four.
In direction, 86.4 percent of the forty-four positions were filled by he directors, and 13.6 percent by she directors in the A+ category. In the A category, 64.6 percent of the 103 positions were filled by he directors, and 35.4 percent by she directors. 68.0 percent of the 122 positions were filled by he directors, and 32.0 percent by she directors in the B+ category. In the B category, 72.6 percent of the 797 positions were filled by he directors, and 27.4 percent by she directors. 74.7 percent of the 168 positions were filled by he directors, and 25.3 percent by she directors in the C-1 category. In the C-2 category, 70.2 percent of the 257 positions were filled by he directors, and 29.8 percent by she directors. In the D category, 63.0 percent of the 1126 positions were filled by he directors, and 37.0 percent by she directors.
Who Directs in LORT Theatres by Gender: Yearly Percentages of Positions by Regions

In region one, from 2012-13 to 2016-17, he directors went from 70.4 percent to 67.2 percent to 64.9 percent to 57.2 percent to 59.2 percent of all direction positions filled each season. She directors went from 29.6 percent to 32.8 percent to 35.1 percent to 42.8 percent to 40.8 percent of all direction design positions filled each season. Over the five seasons studied, he directors filling direction positions decreased 11.2 percent, while she directors filling direction positions increased 11.2 percent.
In region two, from 2012-13 to 2016-17, he directors went from 78.0 percent to 74.2 percent to 70.9 percent to 70.4 percent to 66.3 percent of all direction positions filled each season. She directors went from 22.0 percent to 25.8 percent to 29.1 percent to 29.6 percent to 33.7 percent of all direction design positions filled each season. Over the five seasons studied, he directors filling direction positions decreased 11.7 percent, while she directors filling direction positions increased 11.7 percent.
In region three, from 2012-13 to 2016-17, he directors went from 75.5 percent to 73.7 percent to 67.7 percent to 71.3 percent to 66.7 percent of all direction positions filled each season. She directors went from 24.5 percent to 26.3 percent to 32.3 percent to 28.7 percent to 33.3 percent of all direction design positions filled each season. Over the five seasons studied, he directors filling direction positions decreased 8.8 percent, while she directors filling direction positions increased 8.8 percent.
In region four, from 2012-13 to 2016-17, he directors went from 69.3 percent to 73.9 percent to 69.4 percent to 61.6 percent to 63.5 percent of all direction positions filled each season. She directors went from 30.7 percent to 26.1 percent to 30.6 percent to 38.4 percent to 36.5 percent of all direction design positions filled each season. Over the five seasons studied, he directors filling direction positions decreased 5.8 percent, while she directors filling direction positions increased 5.8 percent.
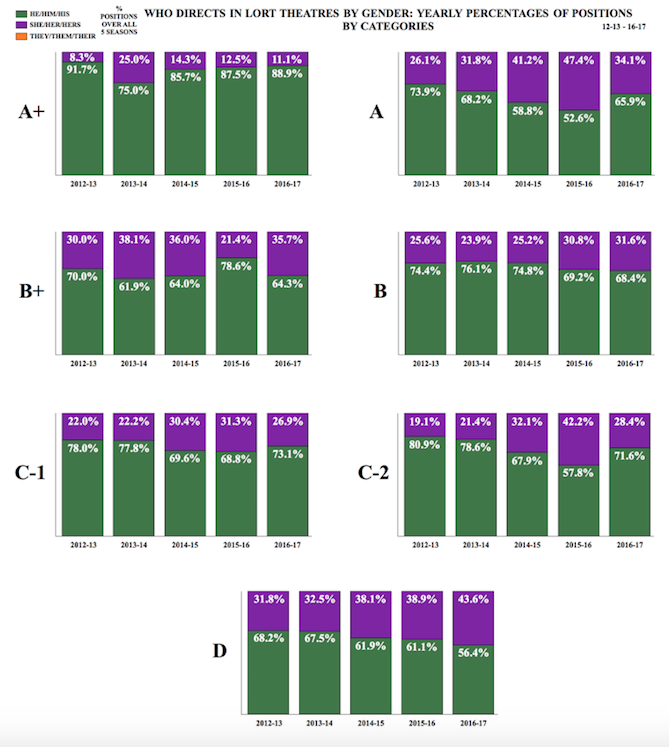
Who Directs in LORT Theatres by Gender: Yearly Percentages of Positions by Categories

In the A+ category, from 2012-13 to 2016-17, he directors went from 91.7 percent to 75.0 percent to 85.7 percent to 87.5 percent to 88.9 percent of all direction positions filled each season. She directors went from 8.3 percent to 25.0 percent to 14.3 percent to 12.5 percent to 11.1 percent of all direction design positions filled each season. Over the five seasons studied, he directors filling direction positions decreased 2.8 percent, while she directors filling direction positions increased 2.8 percent.
In the A category, from 2012-13 to 2016-17, he directors went from 73.9 percent to 68.2 percent to 58.8 percent to 52.6 percent to 65.9 percent of all direction positions filled each season. She directors went from 26.1 percent to 31.8 percent to 41.2 percent to 47.4 percent to 34.1 percent of all direction design positions filled each season. Over the five seasons studied, he directors filling direction positions decreased 8.0 percent, while she directors filling direction positions increased 8.0 percent.
In the B+ category, from 2012-13 to 2016-17, he directors went from 70.0 percent to 61.9 percent to 64.0 percent to 78.6 percent to 64.3 percent of all direction positions filled each season. She directors went from 30.0 percent to 38.1 percent to 36.0 percent to 21.4 percent to 35.7 percent of all direction design positions filled each season. Over the five seasons studied, he directors filling direction positions decreased 5.7 percent, while she directors filling direction positions increased 5.7 percent.
In the B category, from 2012-13 to 2016-17, he directors went from 74.4 percent to 76.1 percent to 74.8 percent to 69.2 percent to 68.4 percent of all direction positions filled each season. She directors went from 25.6 percent to 23.9 percent to 25.2 percent to 30.8 percent to 31.6 percent of all direction design positions filled each season. Over the five seasons studied, he directors filling direction positions decreased 6.0 percent, while she directors filling direction positions increased 6.0 percent.
In the C-1 category, from 2012-13 to 2016-17, he directors went from 78.0 percent to 77.8 percent to 69.6 percent to 68.8 percent to 73.1 percent of all direction positions filled each season. She directors went from 22.0 percent to 22.2 percent to 30.4 percent to 31.3 percent to 26.9 percent of all direction design positions filled each season. Over the five seasons studied, he directors filling direction positions decreased 4.9 percent, while she directors filling direction positions increased 4.9 percent.
In the C-2 category, from 2012-13 to 2016-17, he directors went from 80.9 percent to 78.6 percent to 67.9 percent to 57.8 percent to 71.6 percent of all direction positions filled each season. She directors went from 19.1 percent to 21.4 percent to 32.1 percent to 42.2 percent to 28.4 percent of all direction design positions filled each season. Over the five seasons studied, he directors filling direction positions decreased 9.3 percent, while she directors filling direction positions increased 9.3 percent.
In the D category, from 2012-13 to 2016-17, he directors went from 68.2 percent to 67.5 percent to 61.9 percent to 61.1 percent to 56.4 percent of all direction positions filled each season. She directors went from 31.8 percent to 32.5 percent to 38.1 percent to 38.9 percent to 43.6 percent of all direction design positions filled each season. Over the five seasons studied, he directors filling direction positions decreased 11.8 percent, while she directors filling direction positions increased 11.8 percent.
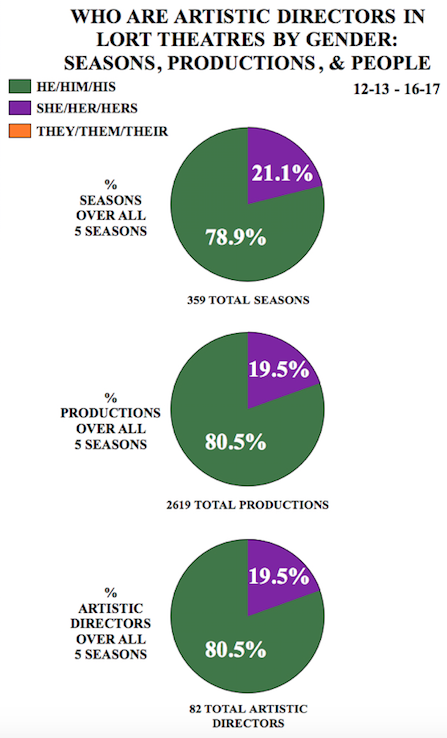
Who are Artistic Directors in LORT Theatres by Gender: Seasons, Productions, and People

Of the 359 seasons, 78.9 percent were led by he artistic directors, and 21.1 percent were led by she artistic directors. Of the 2619 productions, 80.5 percent were led by he artistic directors, and 19.5 percent were led by she artistic directors. He artistic directors were 80.5 percent of all 82 artistic directors, and she artistic directors were 19.5 percent.
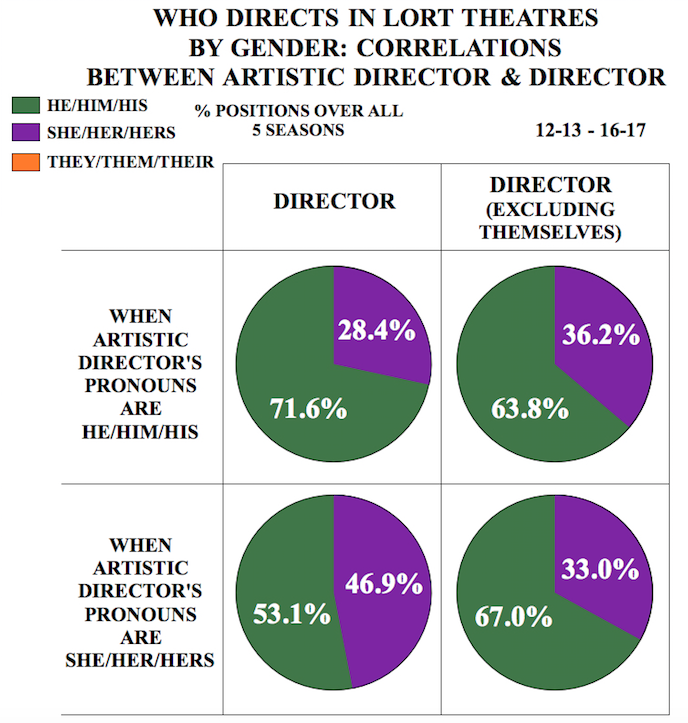
Who Directs in LORT Theatres by Gender: Correlations between Artistic Director & Director

When the artistic director’s pronouns are he/him/his, 71.6 percent of director positions went to he directors, and 28.4 percent to she directors. When the artistic director’s pronouns are she/her/hers, 53.1 percent of director positions went to he directors, and 46.9 percent to she directors. Excluding themselves, when the artistic director’s pronouns are he/him/his, 63.8 percent of director positions went to he directors, and 36.2 percent to she directors. Excluding themselves, when the artistic director’s pronouns are she/her/hers, 67.0 percent of director positions went to he directors, and 33.0 percent to she directors.
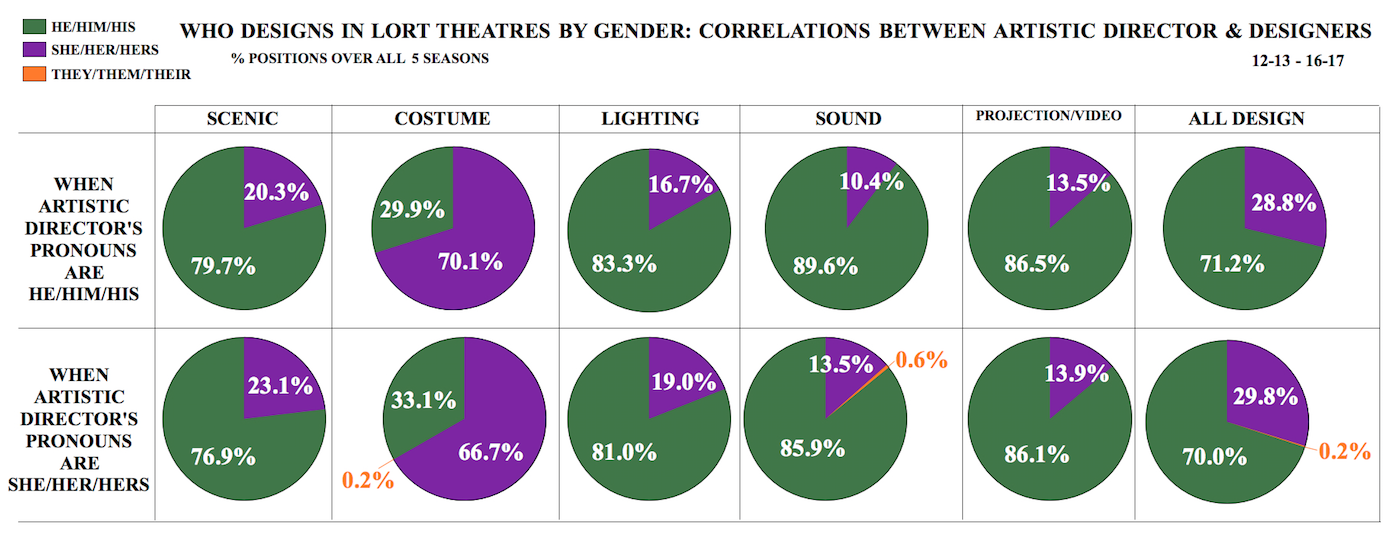
Who Designs in LORT Theatres by Gender: Correlations between Artistic Director and Designers

When the artistic director’s pronouns are he/him/his, 79.7 percent of the 2093 scenic design positions went to he designers, and 20.3 percent to she designers. 70.1 percent of the 2070 costume design positions went to she designers, and 29.9 percent to he designers. Of the 2100 lighting design positions, 83.3 percent went to he designers, and 16.7 percent to she designers. 89.6 percent of the 2018 sound design positions went to he designers, and 10.4 percent to she designers. Of the 352 projection/video design positions, 86.5 percent went to he designers, and 13.5 percent went to she designers. 71.2 percent of all 8633 design positions went to he designers, and 28.8 percent to she designers.
When the artistic director’s pronouns are she/her/hers, 76.9 percent of the 507 scenic design positions went to he designers, and 23.1 percent to she designers. Of the 498 costume design positions, 66.7 percent went to she designers, 33.1 percent to he designers, and 0.2 percent to they designers. 81.0 percent of the 510 lighting design positions went to he designers, and 19.0 percent to she designers. Of the 488 sound design positions, 85.9 percent went to he designers, 13.5 percent to she designers, and 0.6 percent to they designers. 86.1 percent of the 97 projection/video design positions went to he designers, and 13.9 percent to she designers. Of the 2100 design positions, 70.0 percent went to he designers, 29.8 percent to she designers, and 0.2 percent to they designers.
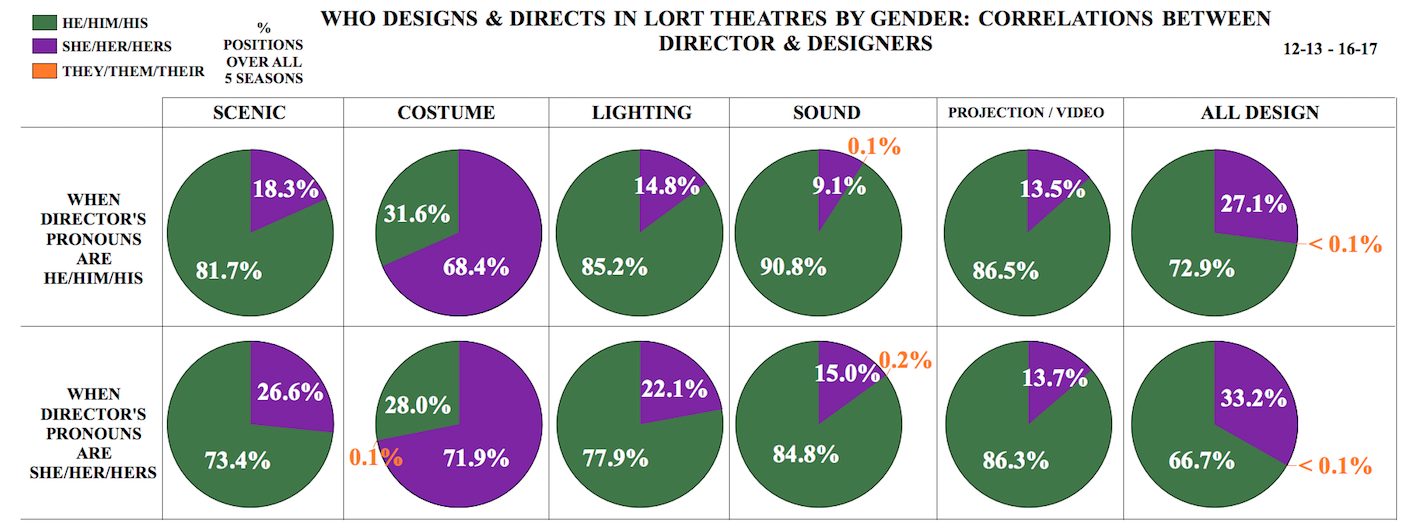
Who Designs and Directs in LORT Theatres by Gender: Correlations between Director and Designers

When the director’s pronouns are he/him/his, 81.7 percent of the 1771 scenic design positions went to he designers, and 18.3 percent to she designers. 68.4 percent of the 1747 costume design positions went to she designers, and 31.6 percent to he designers. Of the 1774 lighting design positions, 85.2 percent went to he designers, and 14.8 percent to she designers. 90.8 percent of the 1711 sound design positions went to he designers, 9.1 percent to she designers, and 0.1 percent to they designers. Of the 310.5 projection/video design positions, 86.5 percent went to he designers, and 13.5 percent to she designers. 72.9 percent of all 7313.5 design positions went to he designers, 27.1 percent to she designers, and less than 0.1 percent to they designers.
When the director’s pronouns are she/her/hers, 73.4 percent of the 830 scenic design positions went to he designers, and 26.6 percent to she designers. Of the 824 costume design positions, 71.9 percent went to she designers, 28.0 percent to he designers, and 0.1 percent to they designers. 77.9 percent of the 836 lighting design positions went to he designers, and 22.1 percent to she designers. Of the 796 sound design positions, 84.8 percent went to he designers, 15.0 percent to she designers, and 0.2 percent to they designers. 86.3 percent of the 138.5 projection/video design positions went to he designers, and 13.7 percent to she designers. Of the 3424.5 design positions, 66.7 percent went to he designers, 33.2 percent to she designers, and less than 0.1 percent to they designers.
Who Designs in LORT Theatres by Gender: All He/Him/His and All She/Her/Hers Design Teams

The following statistics were based on percentage of all teams over the five years examined. When there were less than three designers on a show, that show was excluded from this data.
Of the 2619 total design teams, 80.4 percent were a mix of gender identities, 19.0 percent were teams of all he designers, and 0.6 percent were teams of all she designers.
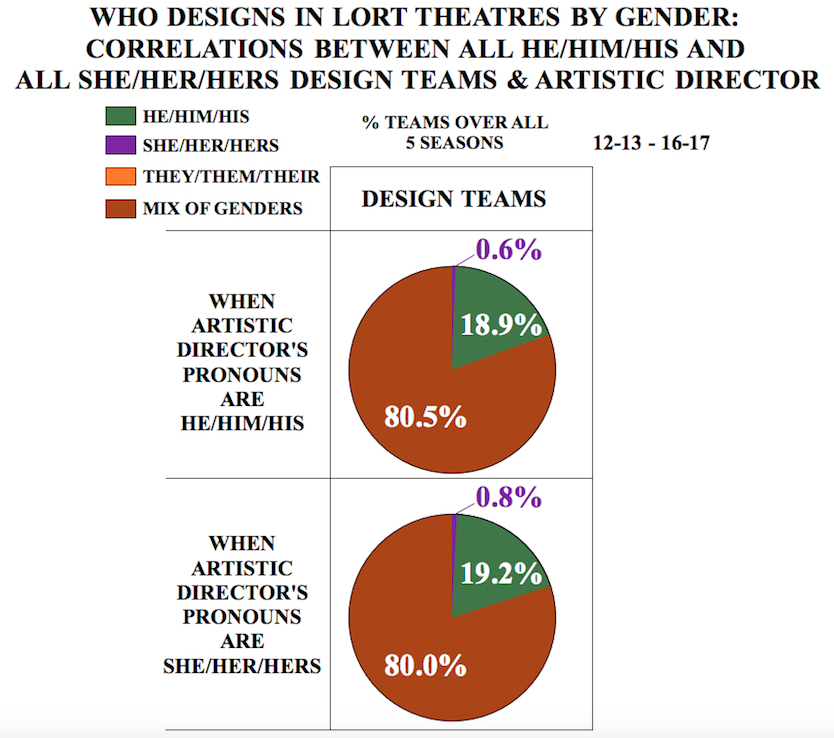
Who Designs in LORT Theatres by Gender: Correlations between All He/Him/His and All She/Her/Hers Design Teams & Artistic Director

The following statistics were based on percentage of all teams over the five years examined. When there were less than three designers on a show, that show was excluded from this data.
When the artistic director’s pronouns are he/him/his, 80.5 percent were a mix of gender identities, 18.9 percent were teams of all he designers, and 0.6 percent were teams of all she designers. When the artistic director’s pronouns are she/her/hers, 80.0 percent were a mix of gender identities, 19.2 percent were teams of all he designers, and 0.8 percent were teams of all she designers.
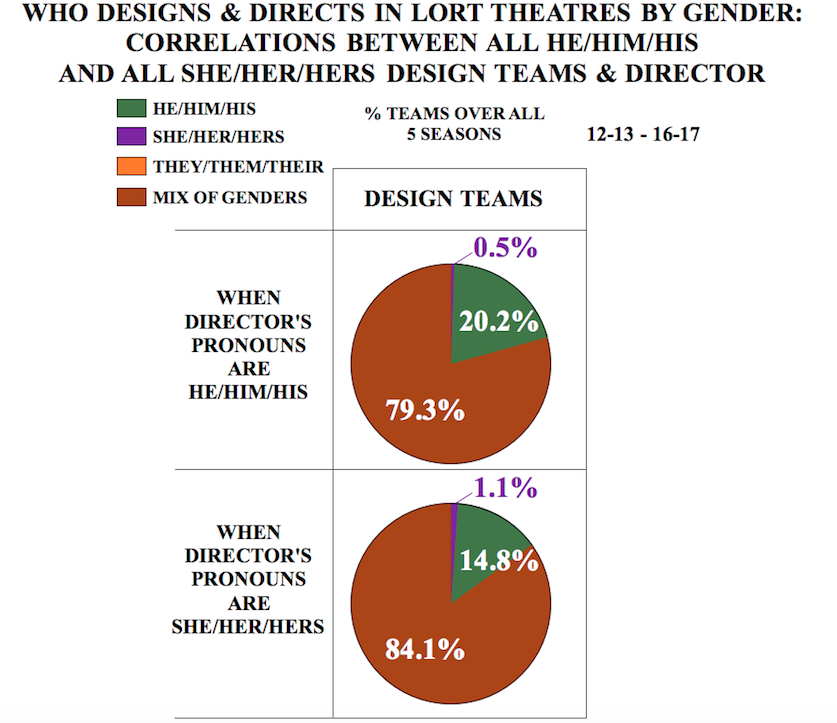
Who Designs and Directs in LORT Theatres by Gender: Correlations between All He/Him/His and All She/Her/Hers Design Teams and Director

The following statistics were based on percentage of all teams over the five years examined. When there were less than three designers on a show, that show was excluded from this data.
When the director’s pronouns are he/him/his, 79.3 percent were a mix of gender identities, 20.2 percent were teams of all he designers, and 0.5 percent were teams of all she designers. When the director’s pronouns are she/her/hers, 84.1 percent were a mix of gender identities, 14.8 percent were teams of all he designers, and 1.1 percent were teams of all she designers.
Who Designs and Directs in LORT Theatres by Gender: Individual Theatre Seasons and Theatres Without

The following statistics are based on all five seasons examined. When a specific design discipline had more no positions than positions filled over the five seasons, they were excluded from the below numbers. As a result, no numbers on projection/video design is included below.
Only three seasons included any designs by they designers. In scenic design, 25.6 percent of individual theatres’ seasons had no she designers designing. 15.0 percent of individual theatres’ seasons had no he designers designing in costume design. In lighting design, 34.0 percent of individual theatres’ seasons had no she designers designing. 54.6 percent of individual theatre seasons had no she designers designing in sound design. In direction, 10.3 percent of individual theatres’ seasons had no she directors directing.
Of the seventy-three theatres over the five seasons of positions, 1.4 percent never had a he costume designer fill one position, 6.8 percent never had a she lighting designer fill one position, and 17.8 percent never had a she sound designer design one show.


Comments
The article is just the start of the conversation—we want to know what you think about this subject, too! HowlRound is a space for knowledge-sharing, and we welcome spirited, thoughtful, and on-topic dialogue. Find our full comments policy here.
Hello Porsche! Once again, I wanted to say thank you for this really excellent data, which I continue to share in my Intro to Theatre class. :-) I was wondering if there was an update with data past the 2017 season? Or have you concluded the project?
Thank you!
Hi Jay! You can find the most recent study here: https://howlround.com/who-designs-and-directs-lort-theatres-pronoun-2019
I love this research! I use it in my classroom to show that institutional bias is still very present. Question: What are the categories for questions two and four?
Thank you for your kind words.
https://www.usa829.org/Por...
Also see part three in this series for more information.