
This is the second installment of phase four of this study. Part one contains top-line takeaways and my methodology. In this section, I have broken the data down by geographic regions.
Who Designs and Directs in LORT Theatres by Gender
Phase Four: Part 2
Essay by
Can't wait for the last two installments next week?
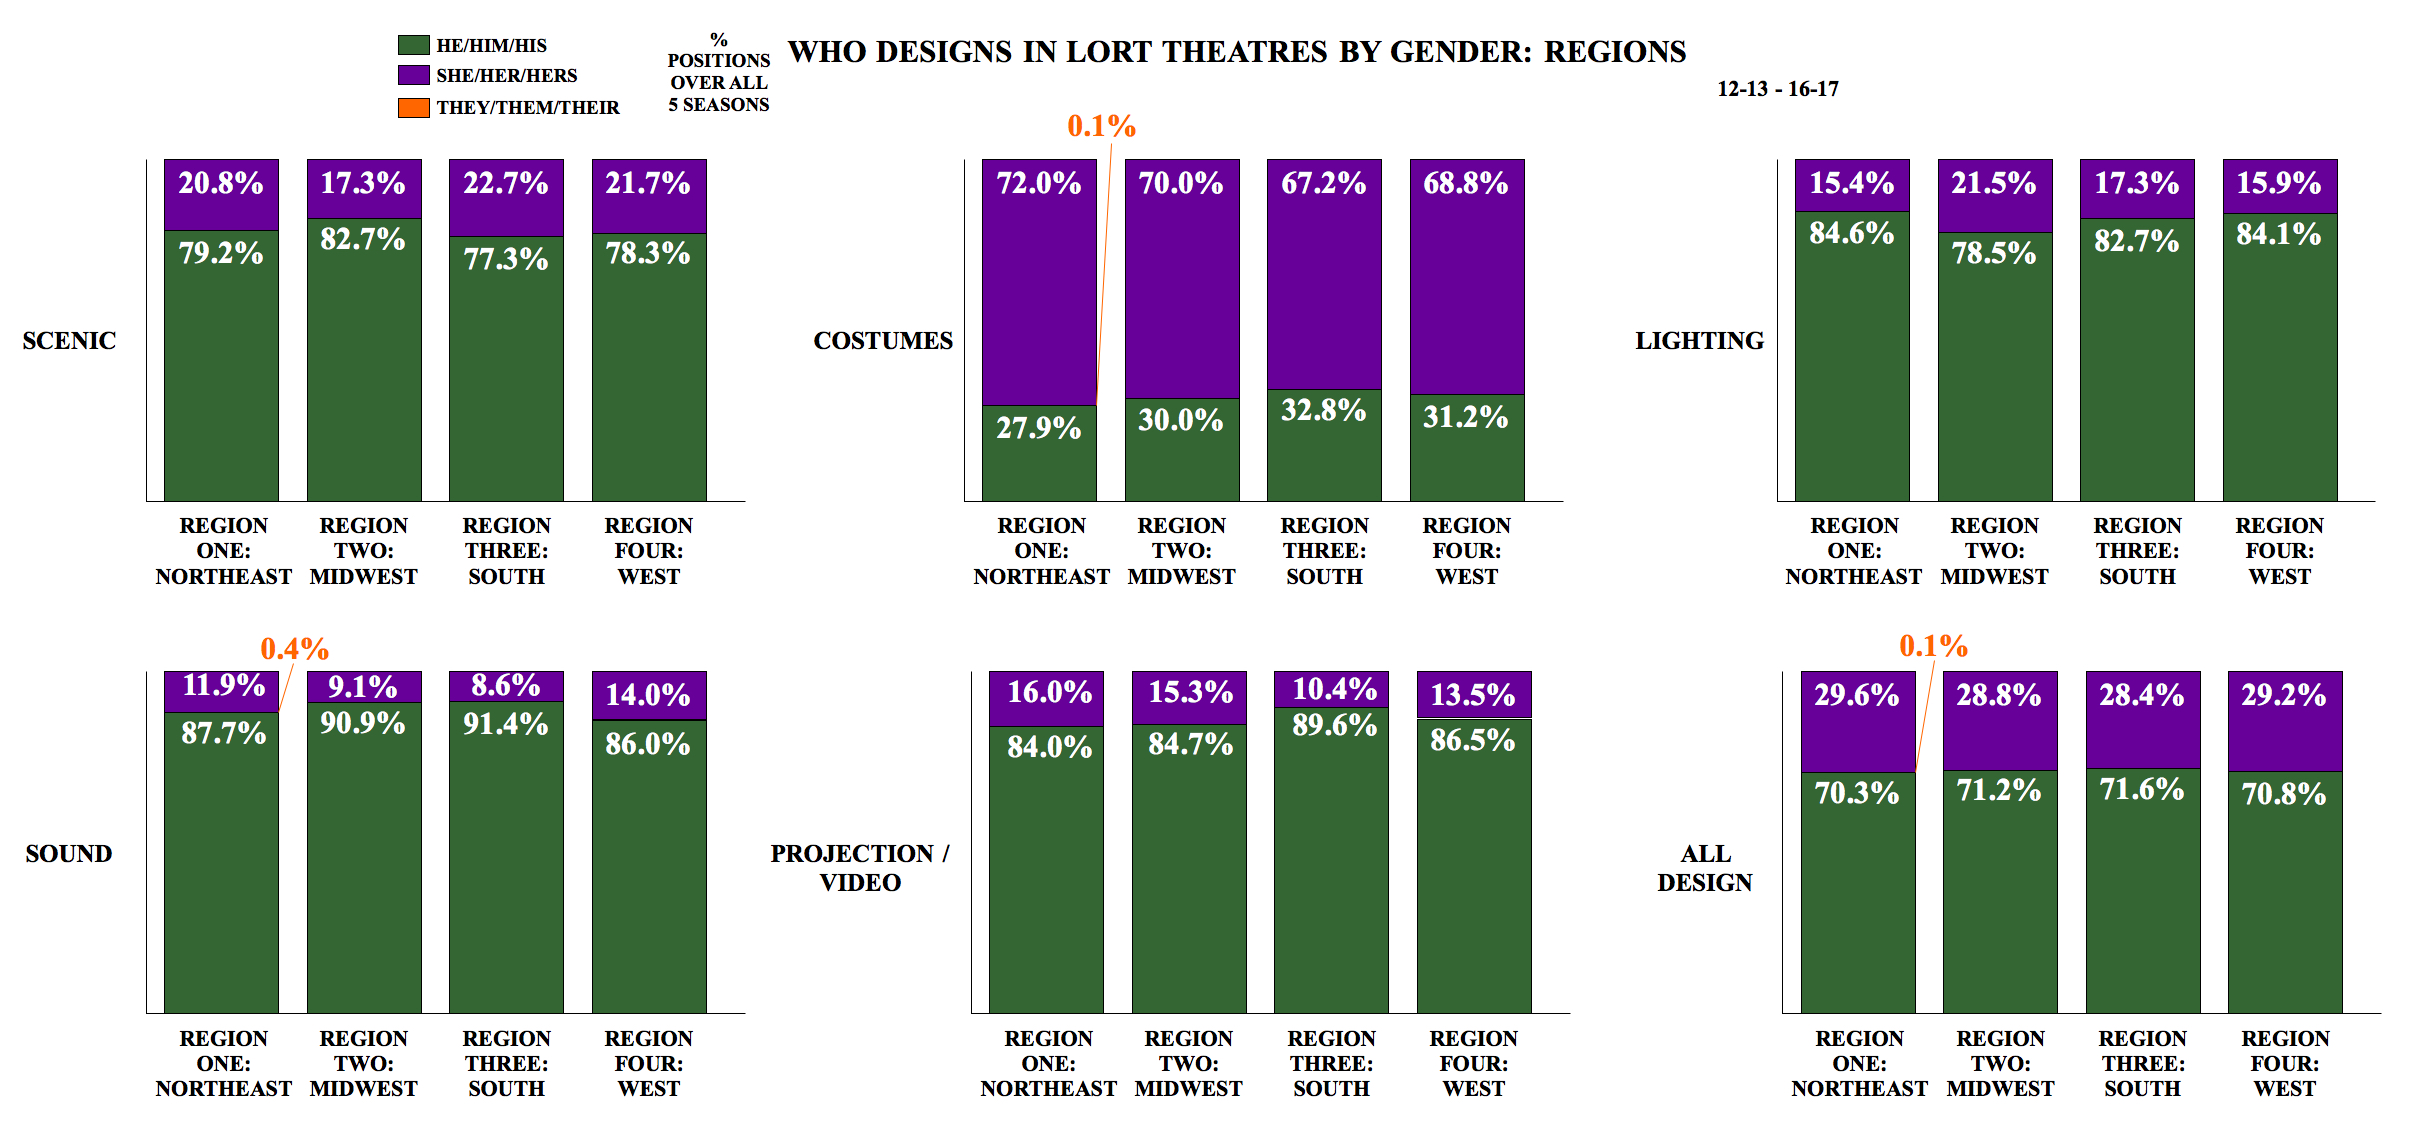
Who Designs in LORT Theatres by Gender: Regions

The following statistics are percentages per the four Census regions of the United States over all five seasons examined. Region one is the Northeast, region two is the Midwest, region three is the South, and region four is the West. For details on which states are considered to be in which regions, visit the Census Bureau.
In scenic design, 79.2 percent of all positions were filled by he designers, and 20.8 percent were filled by she designers in region one. 82.7 percent of positions were filled by he designers, and 17.3 percent were filled by she designers in region two. In region three, 77.3 percent of positions were filled by he designers, and 22.7 percent were filled by she designers. 78.3 percent of positions were filled by he designers, and 21.7 percent were filled by she designers in region four.
In costume design, 72.0 percent of positions were filled by she designers, 27.9 percent by he designers, and 0.1 percent by they designers in region one. In region two, she designers filled 70.0 percent of positions, and he designers filled 30 percent. 67.2 percent of positions were filled by she designers, and 32.8 percent by he designers in region three. In region four, she designers filled 68.8 percent of positions, and he designers filled 31.2 percent.
In lighting design, 84.6 percent of positions were filled by he designers, and 15.4 percent by she designers in region one. In region two, he designers filled 78.5 percent of positions, and she designers filled 21.5 percent. 82.7 percent of positions were filled by he designers, and 17.3 percent by she designers in region three. In region four, 84.1 percent of positions were filled by he designers, and 15.9 percent by she designers.
In sound design, 87.7 percent of positions were filled by he designers, 11.9 percent were filled by she designers, and 0.4 percent by they designers in region one. In region two, 90.9 percent of positions were filled by he designers, and 9.1 percent were filled by she designers. 91.4 percent of positions were filled by he designers, and 8.6 percent were filled by she designers in region three. In region four, 86.0 percent of all positions were filled by he designers, and 14.0 percent were filled by she designers.
In projection/video design, 84.0 percent of positions were filled by he designers and 16.0 percent by she designers in region one. In region two, he designers filled 84.7 percent of all positions, and 15.3 percent by she designers. 89.6 percent of positions were filled by he designers and 10.4 percent by she designers in region three. In region four, 86.5 percent of positions were filled by he designers, and 13.5 percent by she designers.
In all five areas of design studied, 70.3 percent of all positions were filled by he designers, 29.6 percent by she designers, and 0.1 percent by they designers in region one. In region two, he designers filled by 71.2 percent of positions, and she designers filled 28.8 percent. 71.6 percent of positions were filled by he designers and 28.4 percent were filled by she designers in region three. In region four, he designers filled 70.8 percent of positions, and she designers filled 29.2 percent.
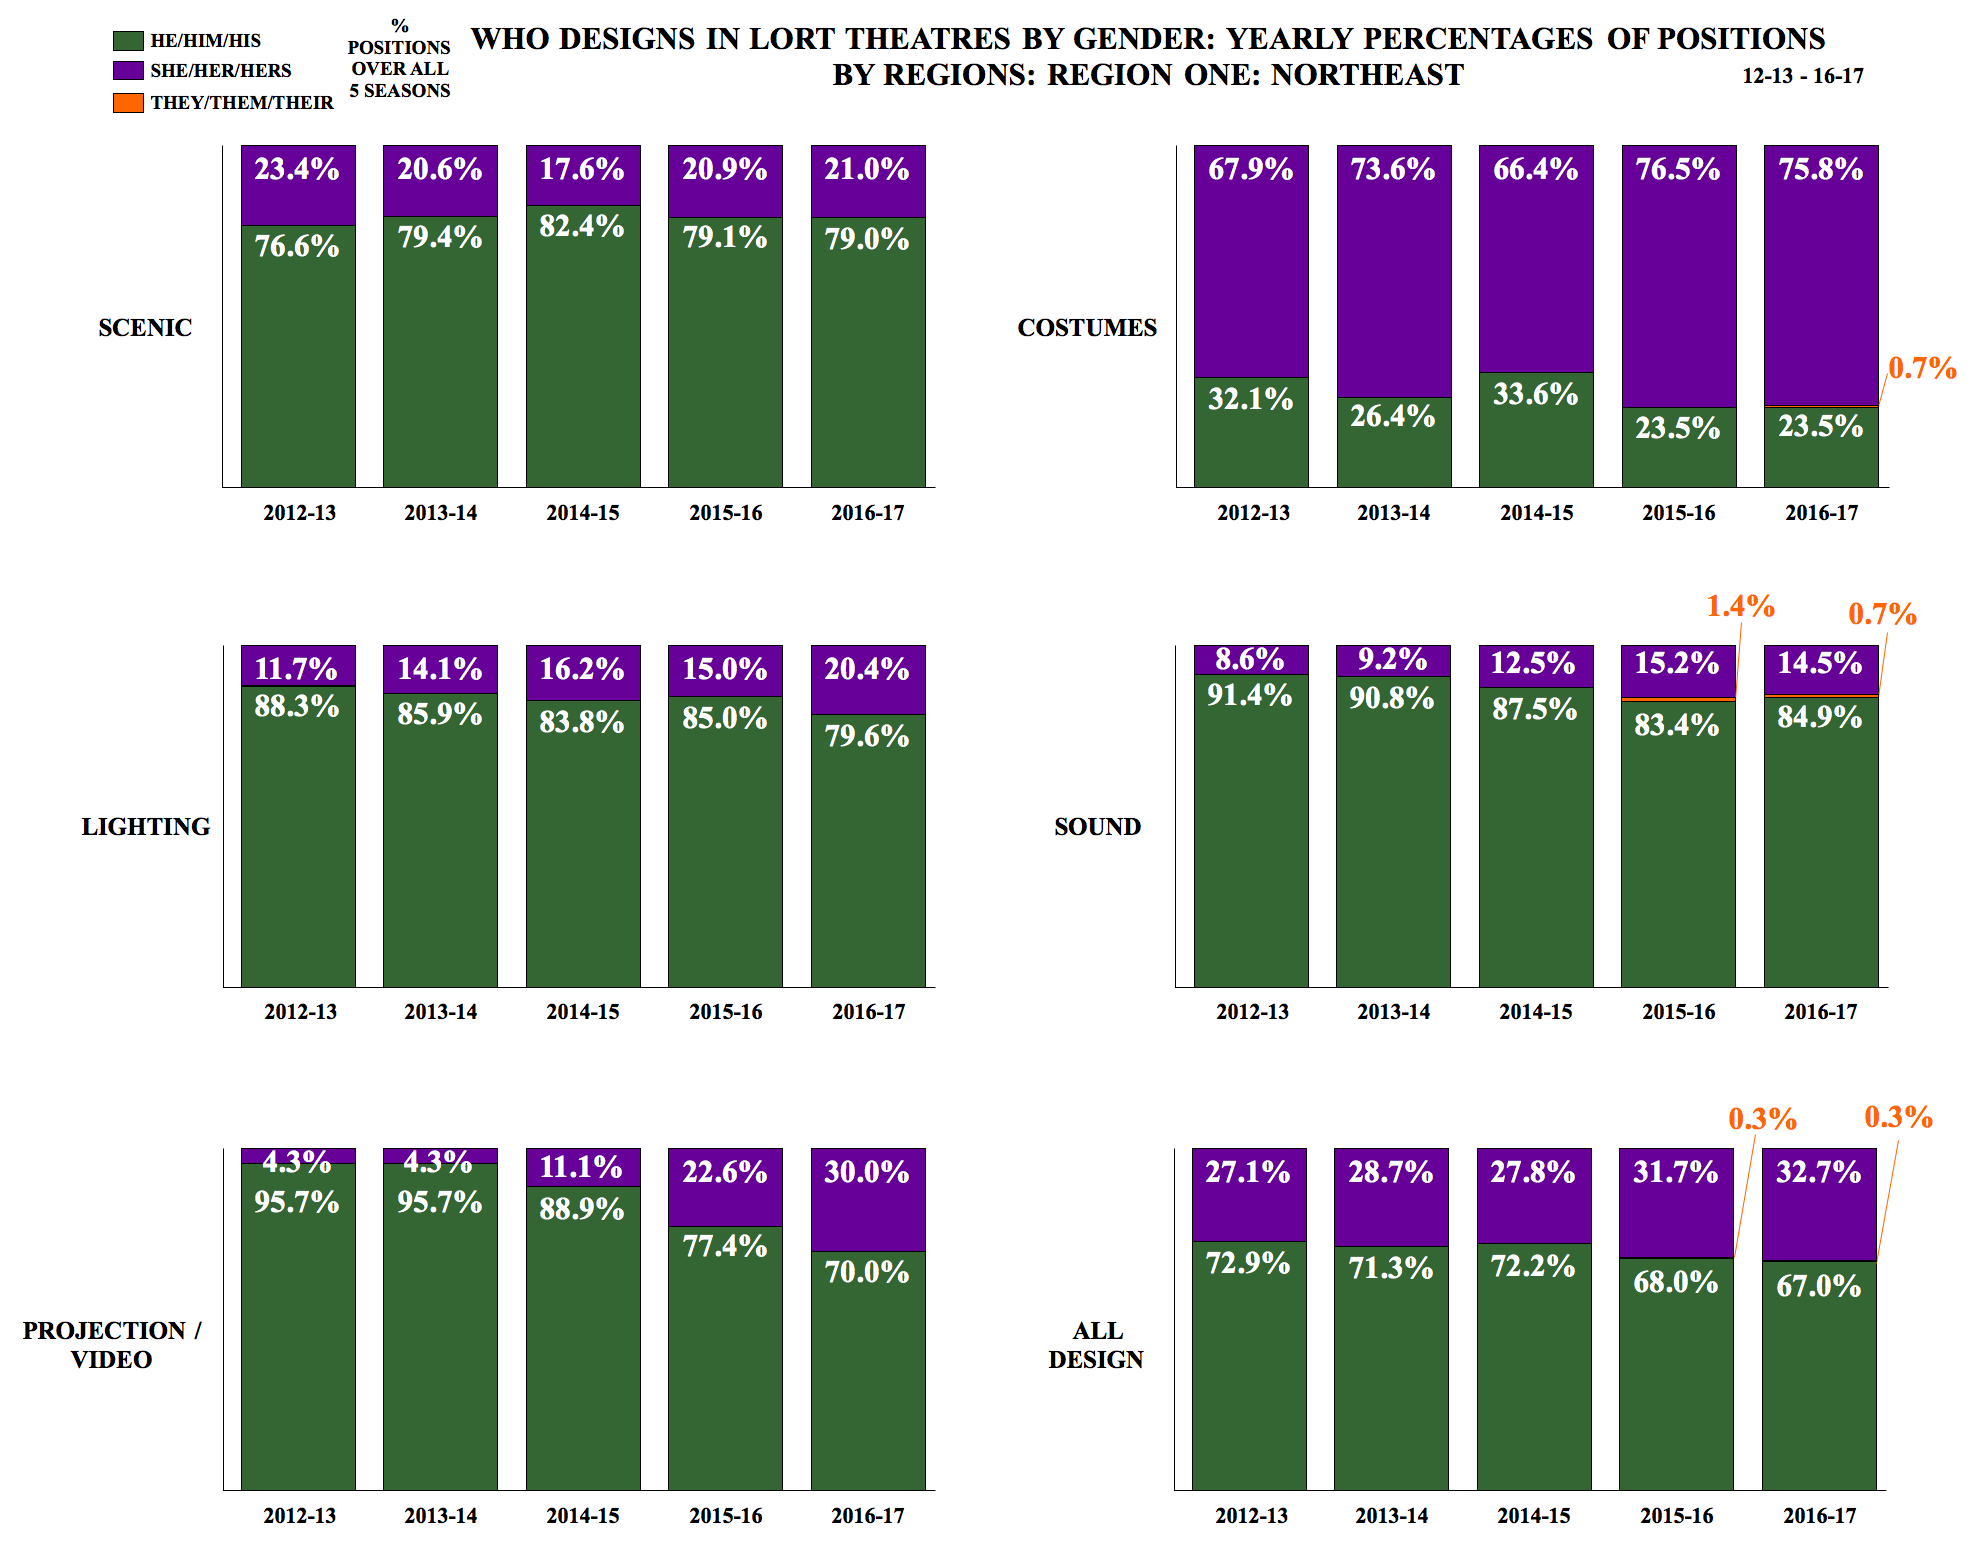
Who Designs in LORT Theatres by Gender: Yearly Percentages of Positions by Regions: Region One: Northeast

In region one, from 2012-13 to 2016-17, he designers went from 76.6 percent to 79.4 percent to 82.4 percent to 79.1 percent to 79.0 percent of all scenic design positions filled each season. She designers went from 23.4 percent to 20.6 percent to 17.6 percent to 20.9 percent to 21.0 percent of all scenic design positions filled each season. Over the five seasons studied, he designers filling scenic design positions increased 2.4 percent, while she designers filling design positions decreased 2.4 percent.
In region one, from 2012-13 to 2016-17, she designers went from 67.9 percent to 73.6 percent to 66.4 percent to 76.5 percent to 75.8 percent of all costume design positions filled each season. He designers went from 32.1 percent to 26.4 percent to 33.6 percent to 23.5 percent to 23.5 percent. They designers were at 0.7 percent for the 2016-17 season. Over the five seasons studied, she designers filling costume design positions increased 7.9 percent, and he designers filling costume design positions decreased 8.6 percent.
In region one, from 2012-13 to 2016-17, he designers went from 88.3 percent to 85.9 percent to 83.8 percent to 85.0 percent to 79.6 percent of all lighting design position filled each season. She designers went from 11.7 percent to 14.1 percent to 16.2 percent to 15.0 percent to 20.4 percent. Over the five seasons studied, he designers filling lighting design positions decreased 8.7 percent, and she designers filling lighting design positions increased 8.7 percent.
In region one, from 2012-13 to 2016-17, he designers went from 91.4 percent to 90.8 percent to 87.5 percent to 83.4 percent to 84.9 percent of all sound design positions filled each season. She designers went from 8.6 percent to 9.2 percent to 12.5 percent to 15.2 percent to 14.5 percent. From the 2015-16 to 2016-17 seasons, they designers went from 1.4 percent to 0.7 percent. Over the five seasons studied, he designers filling sound design positions decreased 6.5 percent, and she designers filling sound design positions increased 5.9 percent.
In region one, from 2012-13 to 2016-17, he designers went from 95.7 percent to 95.7 percent to 88.9 percent to 77.4 percent to 70.0 percent of all projection/video design positions filled each season. She designers went from 4.3 percent to 4.3 percent to 11.1 percent to 22.6 percent to 30.0 percent. Over the five seasons studied, he designers filling projection/video design positions decreased 25.7 percent, and she designers filling projection/video design positions increased 25.7 percent.
In region one, from 2012-13 to 2016-17, he designers went from 72.9 percent to 71.3 percent to 72.2 percent to 68.0 percent to 67.0 percent of all design positions filled. She designers went from 27.1 percent to 28.7 percent to 27.8 percent to 31.7 percent to 32.7 percent. From 2015-16 to 2016-17, they designers remained steady at 0.3 percent. Over the five seasons studied, he designers filling positions decreased 5.9 percent, and she designers filling positions increased 5.6 percent.
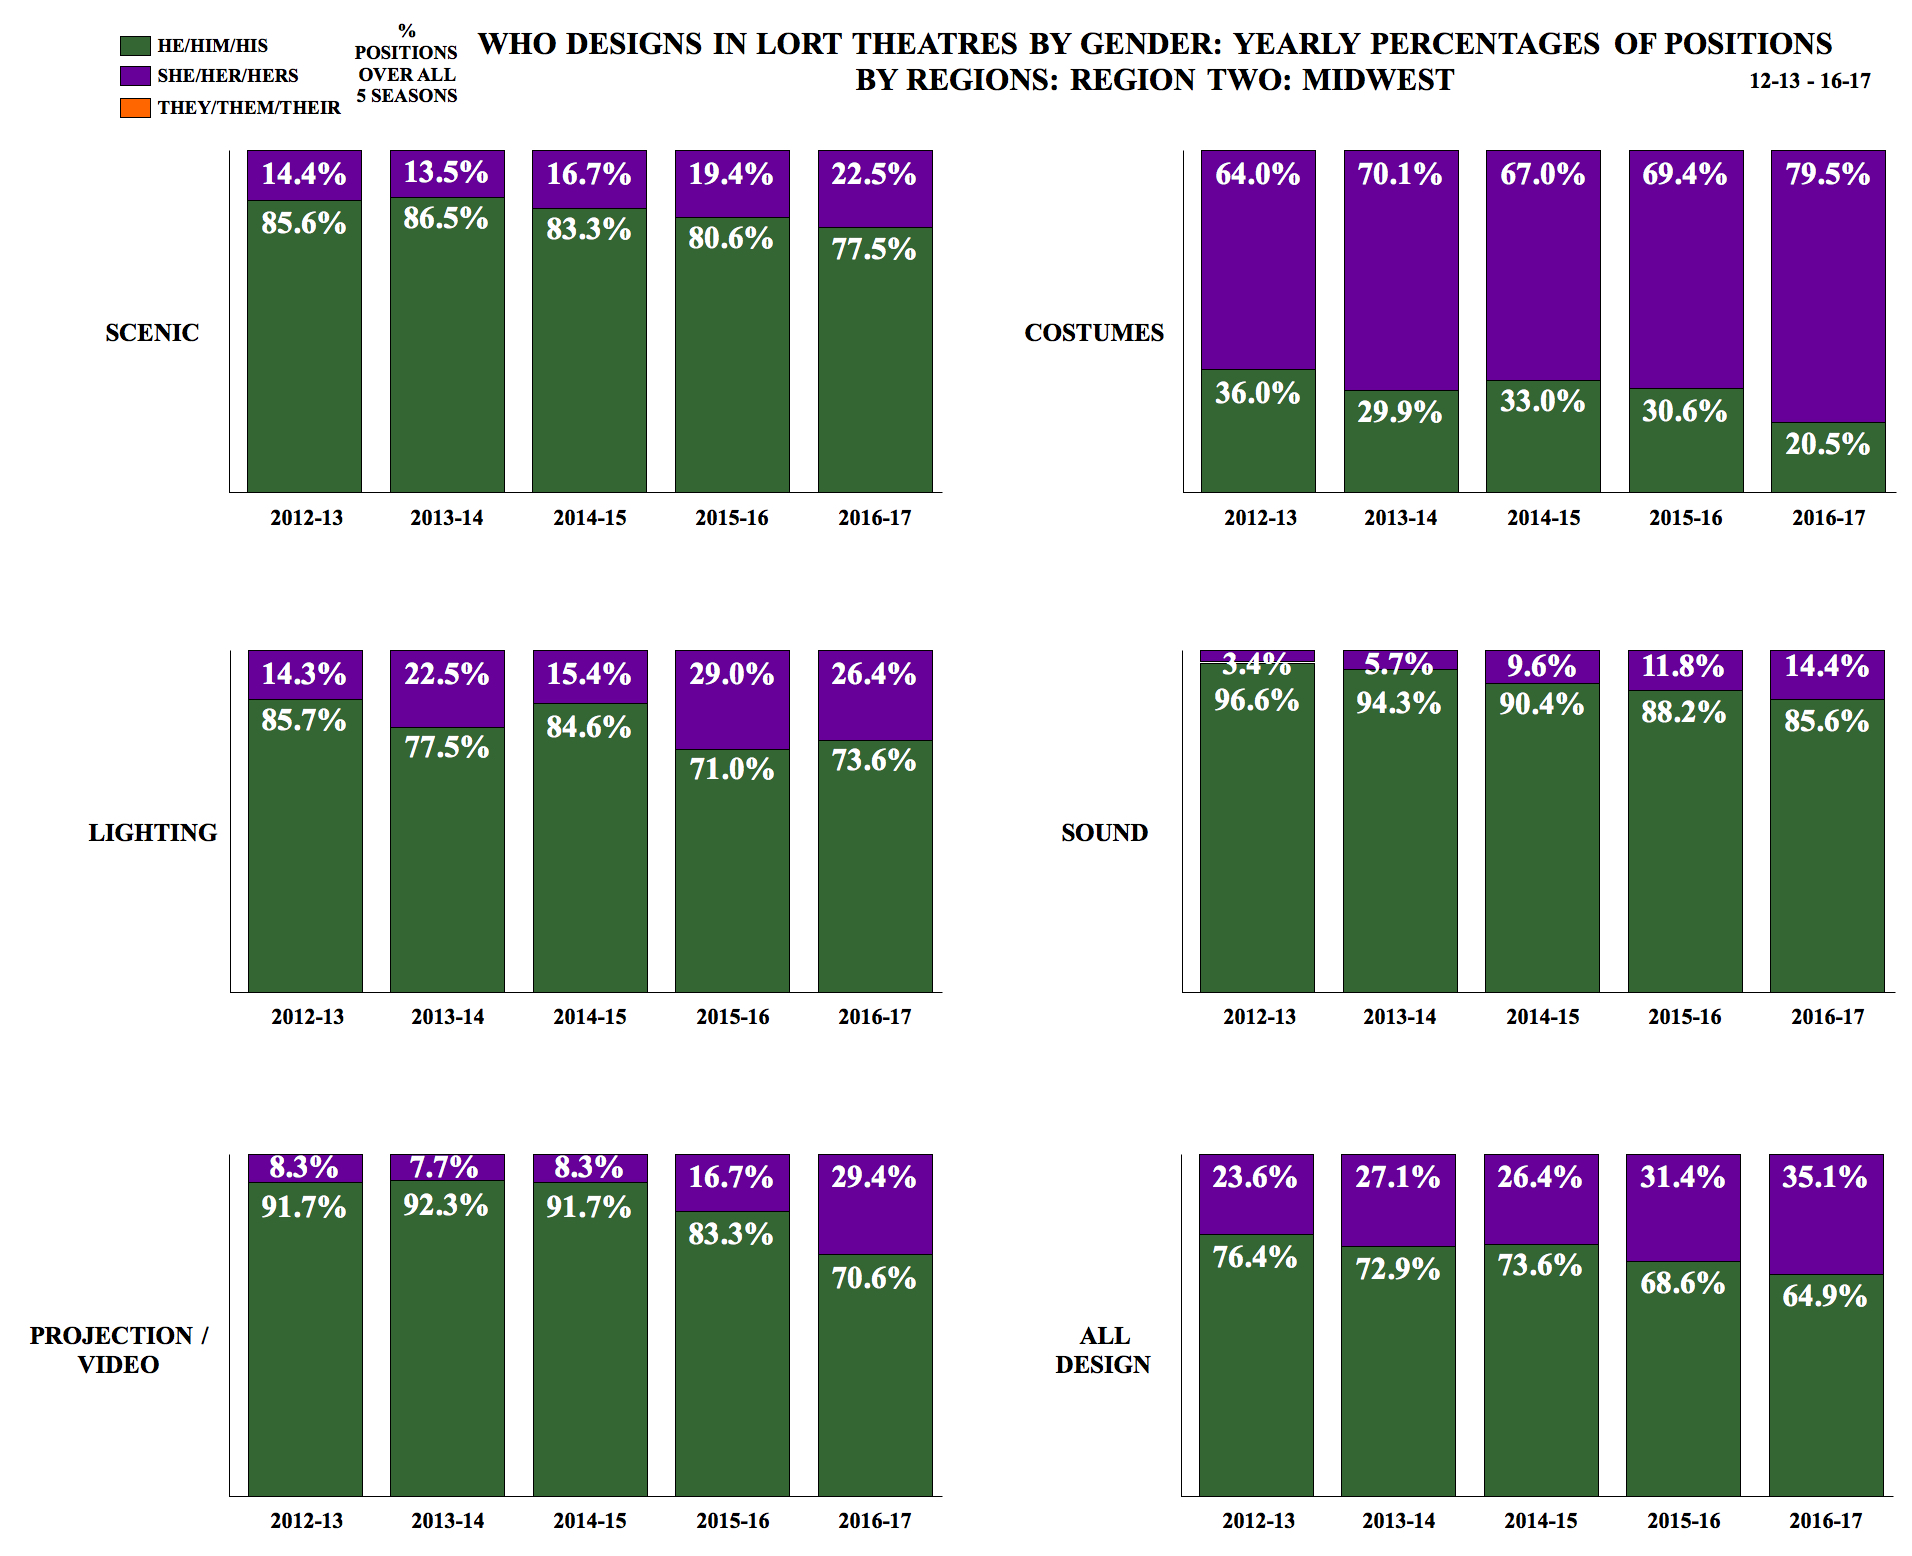
Who Designs in LORT Theatres by Gender: Yearly Percentages of Positions by Regions: Region Two: Midwest

In region two, from 2012-13 to 2016-17, he designers went from 85.6 percent to 86.5 percent to 83.3 percent to 80.6 percent to 77.5 percent of all scenic design positions filled each season. She designers went from 14.4 percent to 13.5 percent to 16.7 percent to 19.4 percent to 22.5 percent of all scenic design positions filled each season. Over the five seasons studied, he designers filling scenic design positions decreased 8.1 percent, while she designers filling scenic design positions increased 8.1 percent.
In region two, from 2012-13 to 2016-17, she designers went from 64.0 percent to 70.1 percent to 67.0 percent to 69.4 percent to 79.5 percent of all costume design positions filled each season. He designers went from 36.0 percent to 29.9 percent to 33.0 percent to 30.6 percent to 20.5 percent. Over the five seasons studied, she designers filling costume design positions increased 15.5 percent, and he designers filling costume design positions decreased 15.5 percent.
In region two, from 2012-13 to 2016-17, he designers went from 85.7 percent to 77.5 percent to 84.6 percent to 71.0 percent to 73.6 percent of all lighting design position filled each season. She designers went from 14.3 percent to 22.5 percent to 15.4 percent to 29.0 percent to 26.4 percent. Over the five seasons studied, he designers filling lighting design positions decreased 12.1 percent, and she designers filling lighting design positions increased 12.1 percent.
In region two, from 2012-13 to 2016-17, he designers went from 96.6 percent to 94.3 percent to 90.4 percent to 88.2 percent to 85.6 percent of all sound design positions filled each season. She designers went from 3.4 percent to 5.7 percent to 9.6 percent to 11.8 percent to 14.4 percent. Over the five seasons studied, he designers filling sound design positions decreased 11.0 percent, and she designers filling sound design positions increased 11.0 percent.
In region two, from 2012-13 to 2016-17, he designers went from 91.7 percent to 92.3 percent to 91.7 percent to 83.3 percent to 70.6 percent of all projection/video design positions filled each season. She designers went from 8.3 percent to 7.7 percent to 8.3 percent to 16.7 percent to 29.4 percent. Over the five seasons studied, he designers filling projection/video design positions decreased 21.1 percent, and she designers filling projection/video design positions increased 21.1 percent.
In region two, from 2012-13 to 2016-17, he designers went from 76.4 percent to 72.9 percent to 73.6 percent to 68.6 percent to 64.9 percent of all design positions filled. She designers went from 23.6 percent to 27.1 percent to 26.4 percent to 31.4 percent to 35.1 percent. Over the five seasons studied, he designers filling positions decreased 11.5 percent, and she designers filling positions increased 11.5 percent.
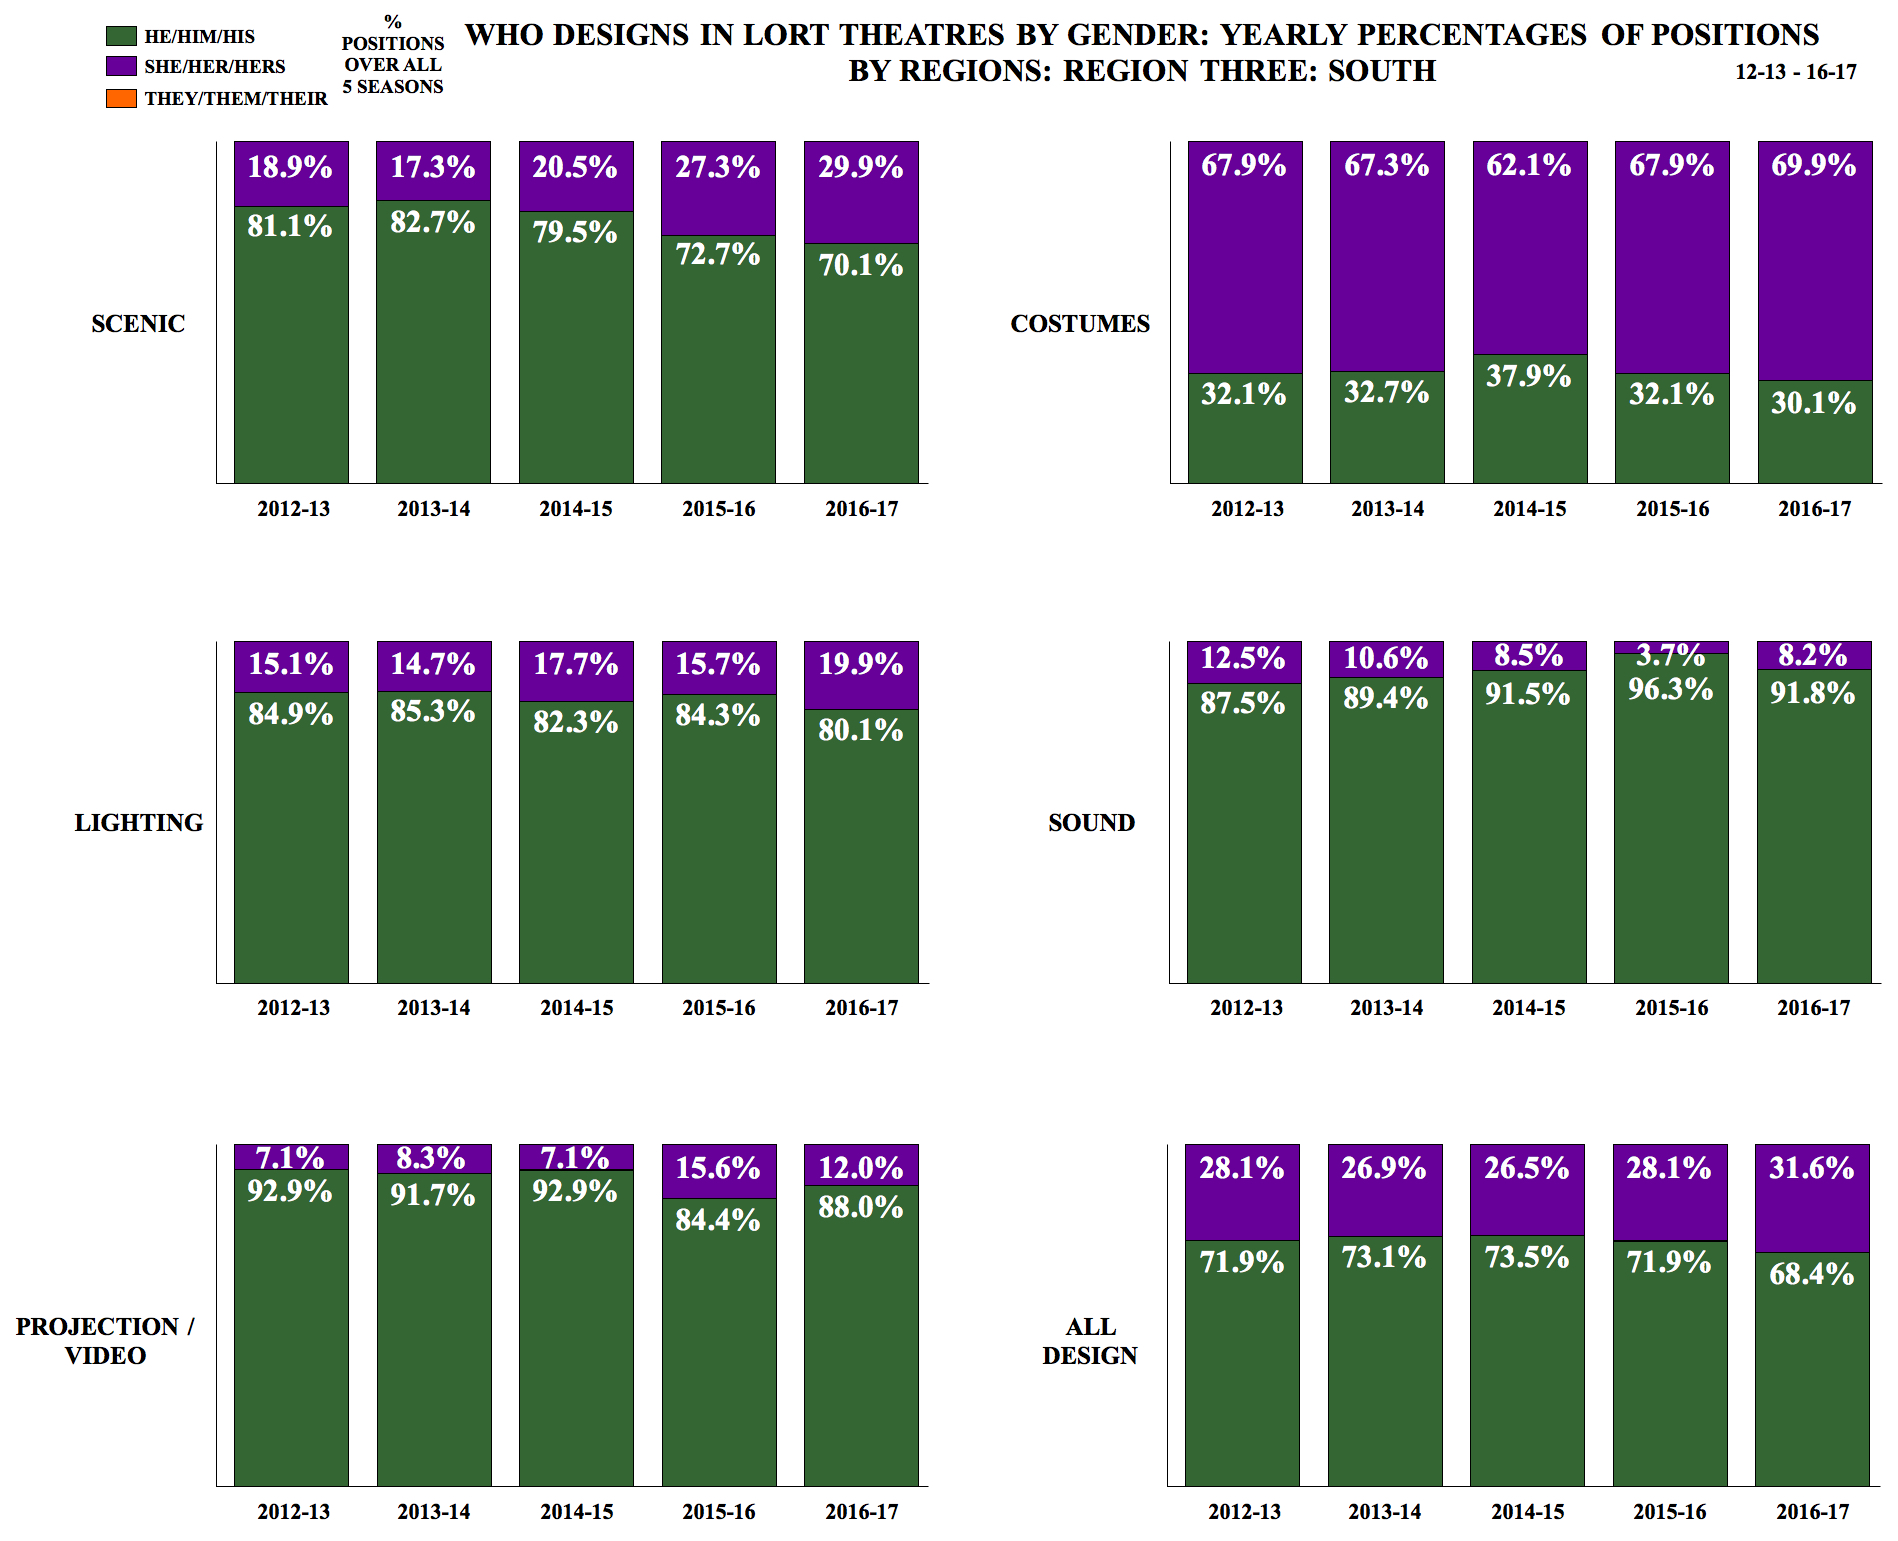
Who Designs in LORT Theatres by Gender: Yearly Percentages of Positions by Regions: Region Three: South

In region three, from 2012-13 to 2016-17, he designers went from 81.1 percent to 82.7 percent to 79.5 percent to 72.7 percent to 70.1 percent of all scenic design positions filled each season. She designers went from 18.9 percent to 17.3 percent to 20.5 percent to 27.3 percent to 29.9 percent of all scenic design positions filled each season. Over the five seasons studied, he designers filling scenic design positions decreased 11.0 percent, while she designers filling scenic design positions increased 11.0 percent.
In region three, from 2012-13 to 2016-17, she designers went from 67.9 percent to 67.3 percent to 62.1 percent to 67.9 percent to 69.9 percent of all costume design positions filled each season. He designers went from 32.1 percent to 32.7 percent to 37.9 percent to 32.1 percent to 30.1 percent. Over the five seasons studied, she designers filling costume design positions increased 2.0 percent, and he designers filling costume design positions decreased 2.0 percent.
In region three, from 2012-13 to 2016-17, he designers went from 84.9 percent to 85.3 percent to 82.3 percent to 84.3 percent to 80.1 percent of all lighting design position filled each season. She designers went from 15.1 percent to 14.7 percent to 17.7 percent to 15.7 percent to 19.9 percent. Over the five seasons studied, he designers filling lighting design positions decreased 4.8 percent, and she designers filling lighting design positions increased 4.8 percent.
In region three, from 2012-13 to 2016-17, he designers went from 87.5 percent to 89.4 percent to 91.5 percent to 96.3 percent to 91.8 percent of all sound design positions filled each season. She designers went from 12.5 percent to 10.6 percent to 8.5 percent to 3.7 percent to 8.2 percent. Over the five seasons studied, he designers filling sound design positions increased 4.3 percent, and she designers filling sound design positions decreased 4.3 percent.
In region three, from 2012-13 to 2016-17, he designers went from 92.9 percent to 91.7 percent to 92.9 percent to 84.4 percent to 88.0 percent of all projection/video design positions filled each season. She designers went from 7.1 percent to 8.3 percent to 7.1 percent to 15.6 percent to 12.0 percent. Over the five seasons studied, he designers filling projection/video design positions decreased 4.9 percent, and she designers filling projection/video design positions increased 4.9 percent.
In region three, from 2012-13 to 2016-17, he designers went from 71.9 percent to 73.1 percent to 73.5 percent to 71.9 percent to 68.4 percent of all design positions filled. She designers went from 28.1 percent to 26.9 percent to 26.5 percent to 28.1 percent to 31.6 percent. Over the five seasons studied, he designers filling positions decreased 3.5 percent, and she designers filling positions increased 3.5 percent.
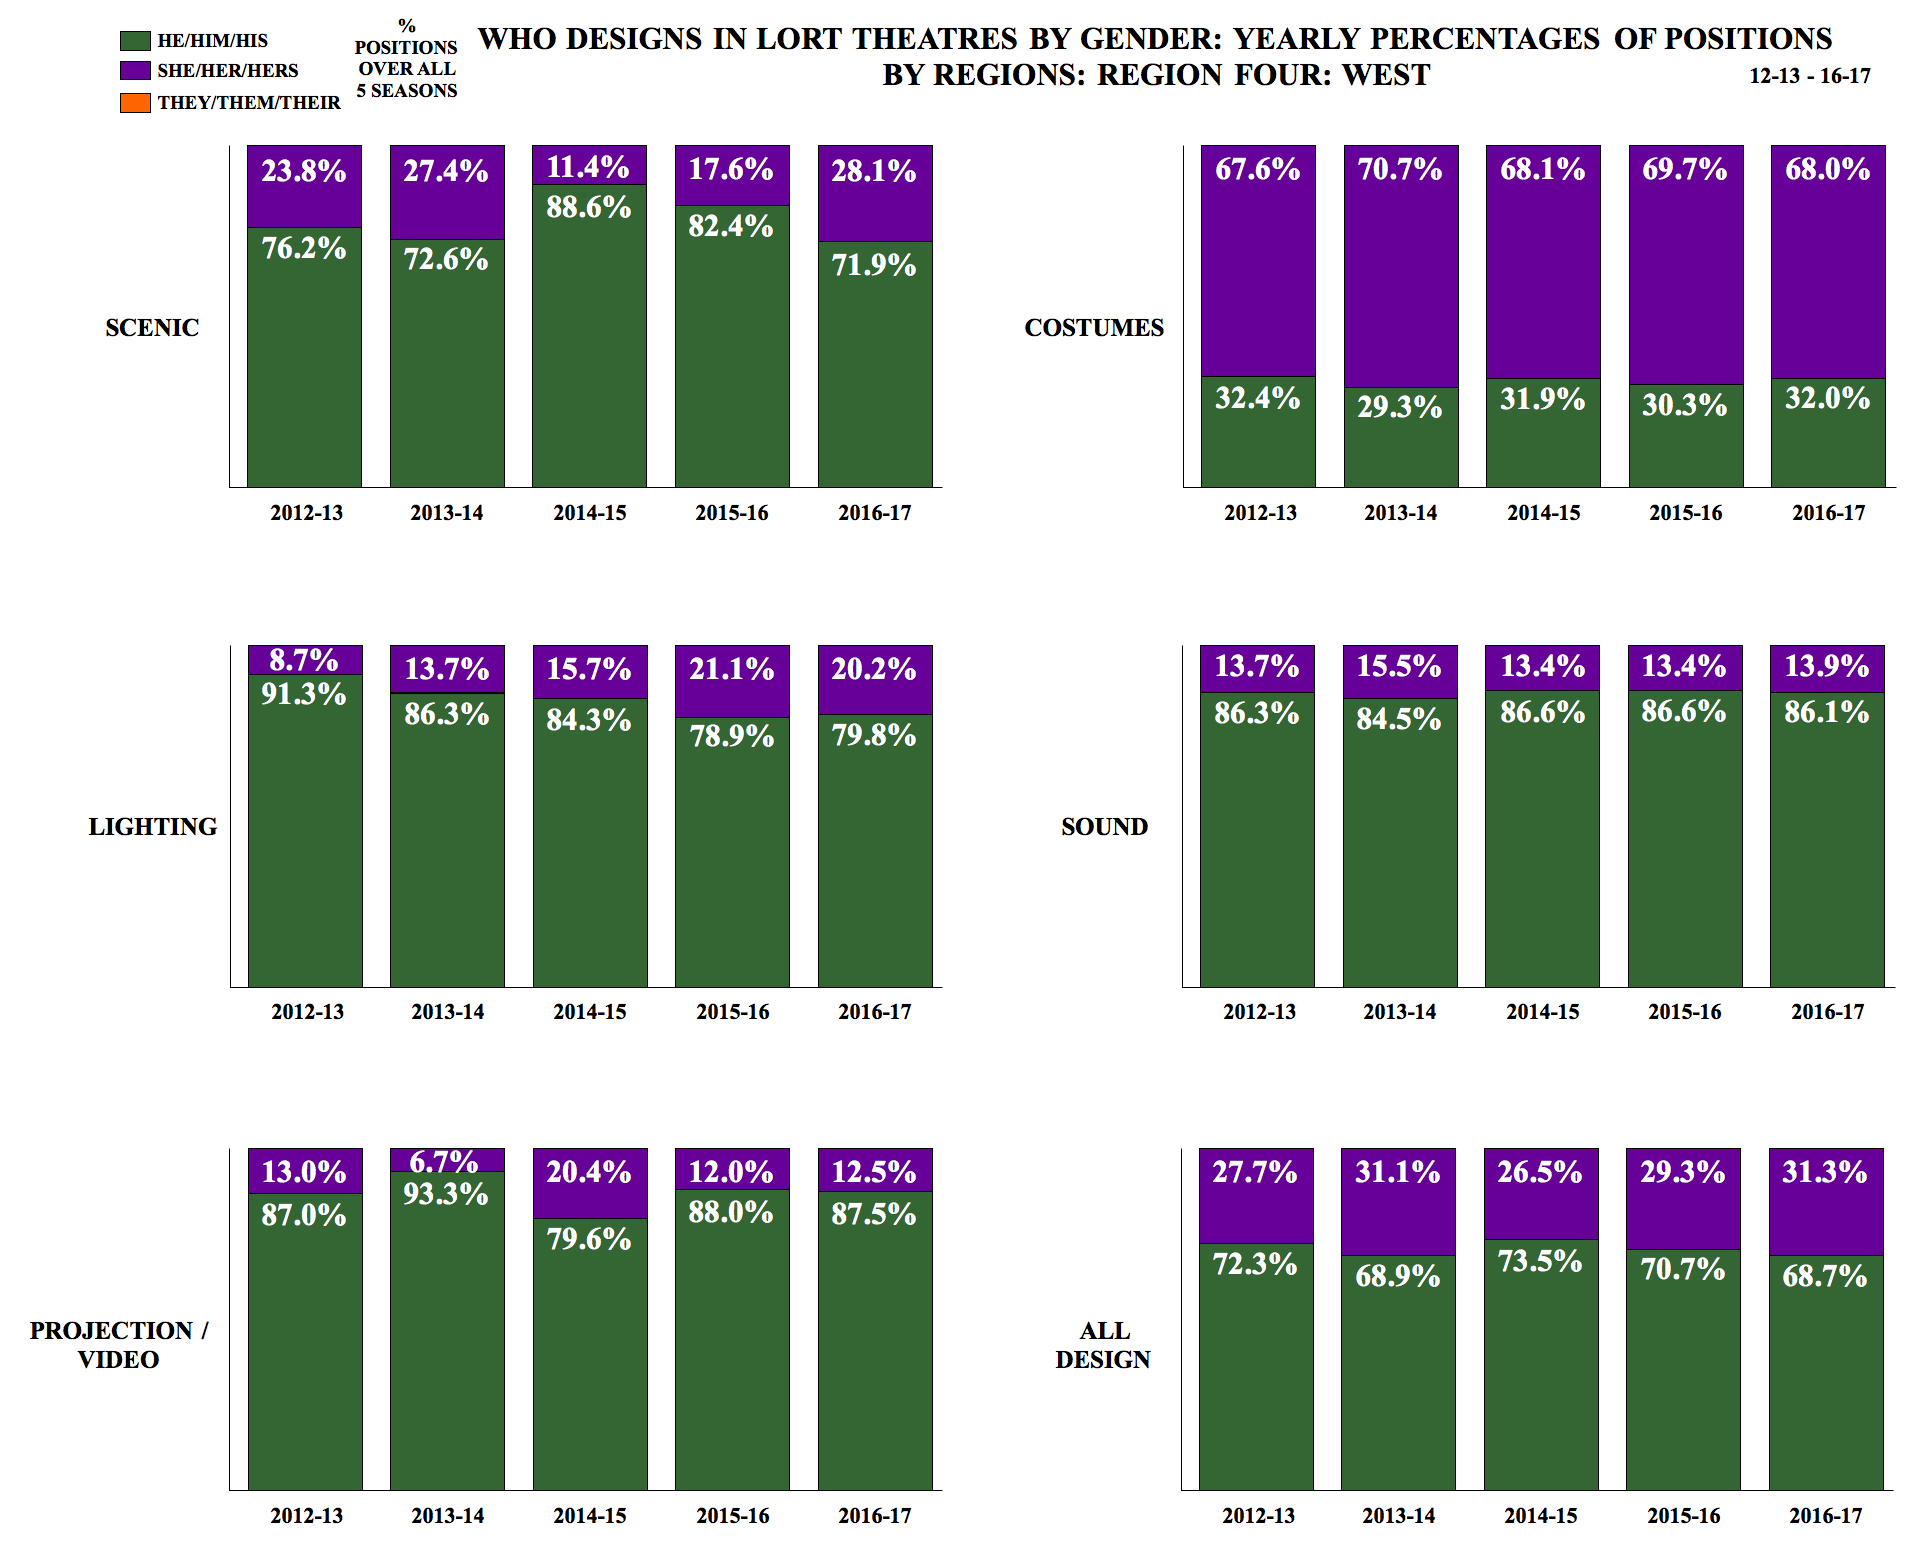
Who Designs in LORT Theatres by Gender: Yearly Percentages of Positions by Regions: Region Four: West

In region four, from 2012-13 to 2016-17, he designers went from 76.2 percent to 72.6 percent to 88.6 percent to 82.4 percent to 71.9 percent of all scenic design positions filled each season. She designers went from 23.8 percent to 27.4 percent to 11.4 percent to 17.6 percent to 28.1 percent of all scenic design positions filled each season. Over the five seasons studied, he designers filling scenic design positions decreased 4.3 percent, while she designers filling scenic design positions increased 4.3 percent.
In region four, from 2012-13 to 2016-17, she designers went from 67.6 percent to 70.7 percent to 68.1 percent to 69.7 percent to 68.0 percent of all costume design positions filled each season. He designers went from 32.4 percent to 29.3 percent to 31.9 percent to 30.3 percent to 32.0 percent. Over the five seasons studied, she designers filling costume design positions increased 0.4 percent, and he designers filling costume design positions decreased 0.4 percent.
In region four, from 2012-13 to 2016-17, he designers went from 91.3 percent to 86.3 percent to 84.3 percent to 78.9 percent to 79.8 percent of all lighting design position filled each season. She designers went from 8.7 percent to 13.7 percent to 15.7 percent to 21.1 percent to 20.2 percent. Over the five seasons studied, he designers filling lighting design positions decreased 11.5 percent, and she designers filling lighting design positions increased 11.5 percent.
In region four, from 2012-13 to 2016-17, he designers went from 86.3 percent to 84.5 percent to 86.6 percent to 86.6 percent to 86.1 percent of all sound design positions filled each season. She designers went from 13.7 percent to 15.5 percent to 13.4 percent to 13.4 percent to 13.9 percent. Over the five seasons studied, he designers filling sound design positions decreased 0.2 percent, and she designers filling sound design positions decreased 0.2 percent.
In region four, from 2012-13 to 2016-17, he designers went from 87.0 percent to 93.3 percent to 79.6 percent to 88.0 percent to 87.5 percent of all projection/video design positions filled each season. She designers went from 13.0 percent to 6.7 percent to 20.4 percent to 12.0 percent to 12.5 percent. Over the five seasons studied, he designers filling projection/video design positions increased 0.5 percent, and she designers filling projection/video design positions decreased 0.5 percent.
In region four, from 2012-13 to 2016-17, he designers went from 72.3 percent to 68.9 percent to 73.5 percent to 70.7 percent to 68.7 percent of all design positions filled. She designers went from 27.7 percent to 31.1 percent to 26.5 percent to 29.3 percent to 31.3 percent. Over the five seasons studied, he designers filling positions decreased 3.6 percent, and she designers filling positions increased 3.6 percent.
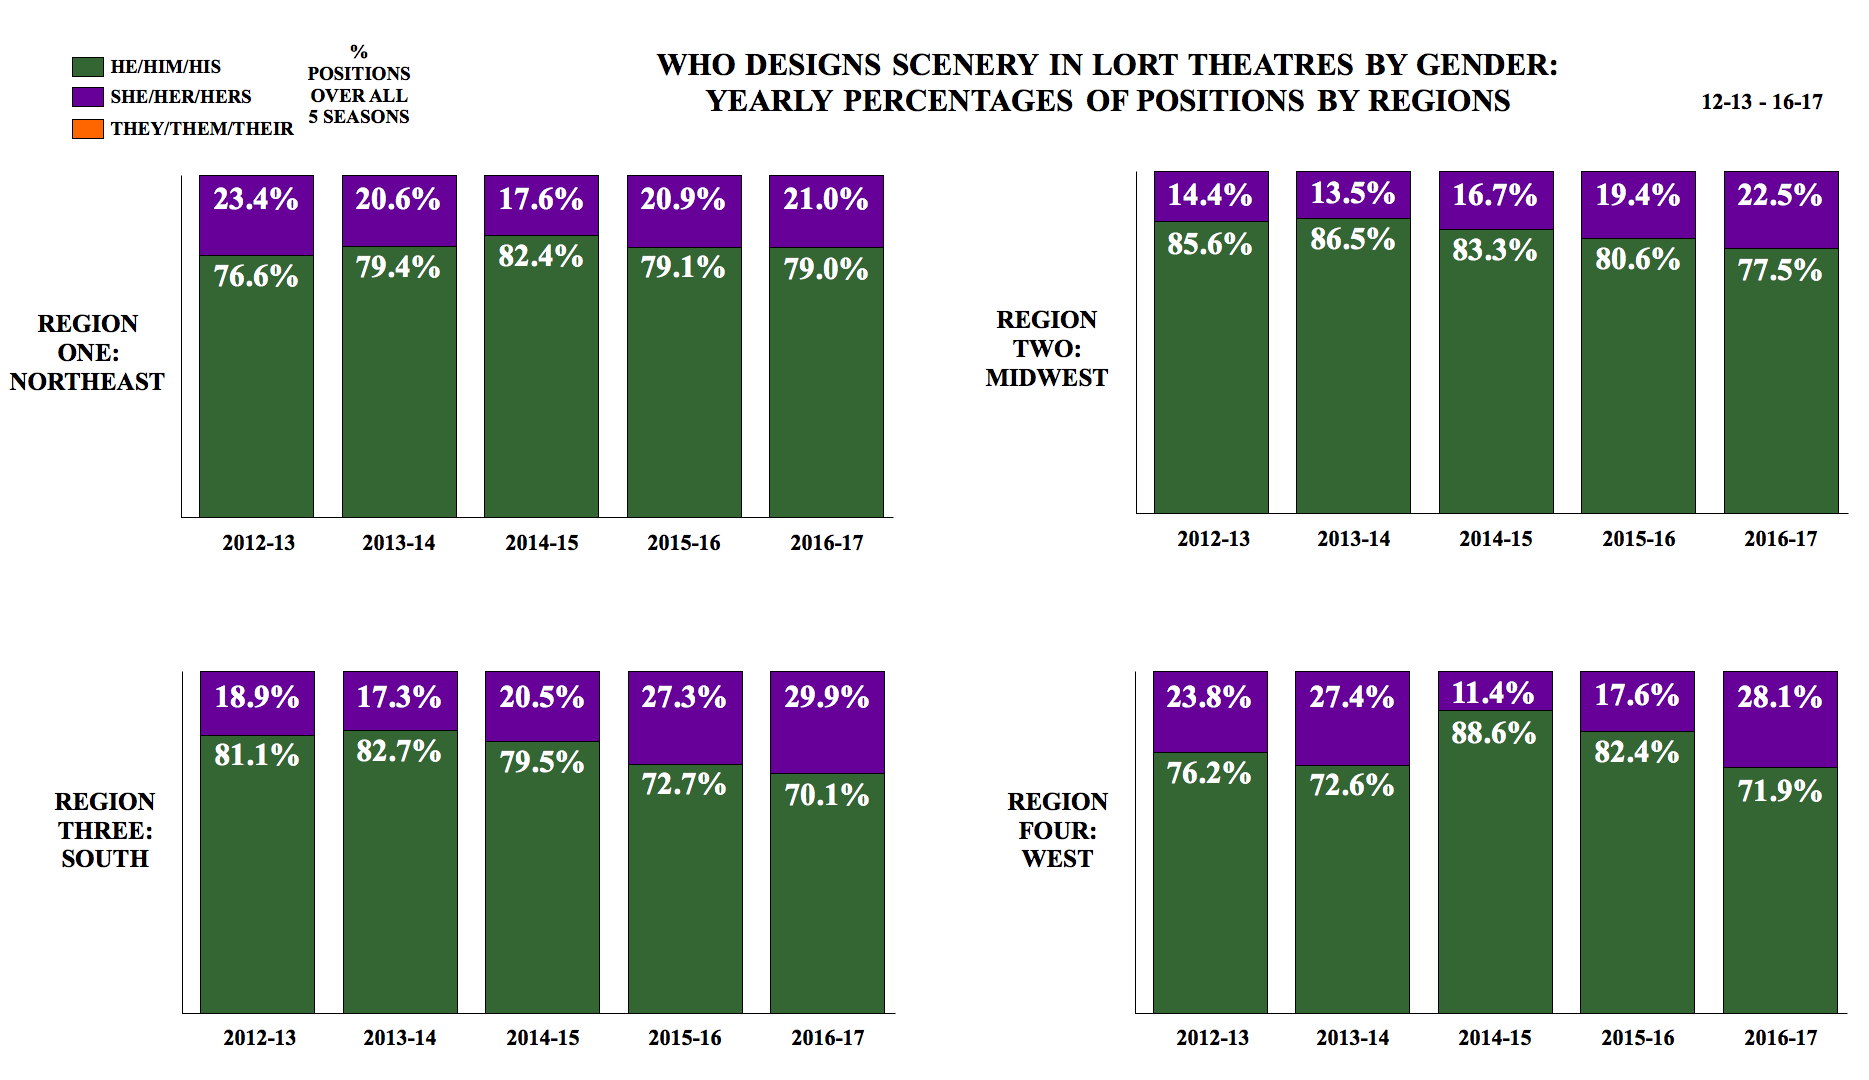
Who Designs Scenery in LORT Theatres by Gender: Yearly Percentages of Positions by Regions

In region one, from 2012-13 to 2016-17, he designers went from 76.6 percent to 79.4 percent to 82.4 percent to 79.1 percent to 79.0 percent of all scenic design positions filled each season. She designers went from 23.4 percent to 20.6 percent to 17.6 percent to 20.9 percent to 21.0 percent of all scenic design positions filled each season. Over the five seasons studied, he designers filling scenic design positions increased 2.4 percent, while she designers filling scenic design positions decreased 2.4 percent.
In region two, from 2012-13 to 2016-17, he designers went from 85.6 percent to 86.5 percent to 83.3 percent to 80.6 percent to 77.5 percent of all scenic design positions filled each season. She designers went from 14.4 percent to 13.5 percent to 16.7 percent to 19.4 percent to 22.5 percent of all scenic design positions filled each season. Over the five seasons studied, he designers filling scenic positions decreased 8.1 percent, while she designers filling scenic design positions increased 8.1 percent.
In region three, from 2012-13 to 2016-17, he designers went from 81.1 percent to 82.7 percent to 79.5 percent to 72.7 percent to 70.1 percent of all scenic design positions filled each season. She designers went from 18.9 percent to 17.3 percent to 20.5 percent to 27.3 percent to 29.9 percent of all scenic design positions filled each season. Over the five seasons studied, he designers filling scenic design positions decreased 11.0 percent, while she designers filling scenic design positions increased 11.0 percent.
In region four, from 2012-13 to 2016-17, he designers went from 76.2 percent to 72.6 percent to 88.6 percent to 82.4 percent to 71.9 percent of all scenic design positions filled each season. She designers went from 23.8 percent to 27.4 percent to 11.4 percent to 17.6 percent to 28.1 percent of all scenic design positions filled each season. Over the five seasons studied, he designers filling scenic design positions decreased 4.3 percent, while she designers filling scenic design positions increased 4.3 percent.
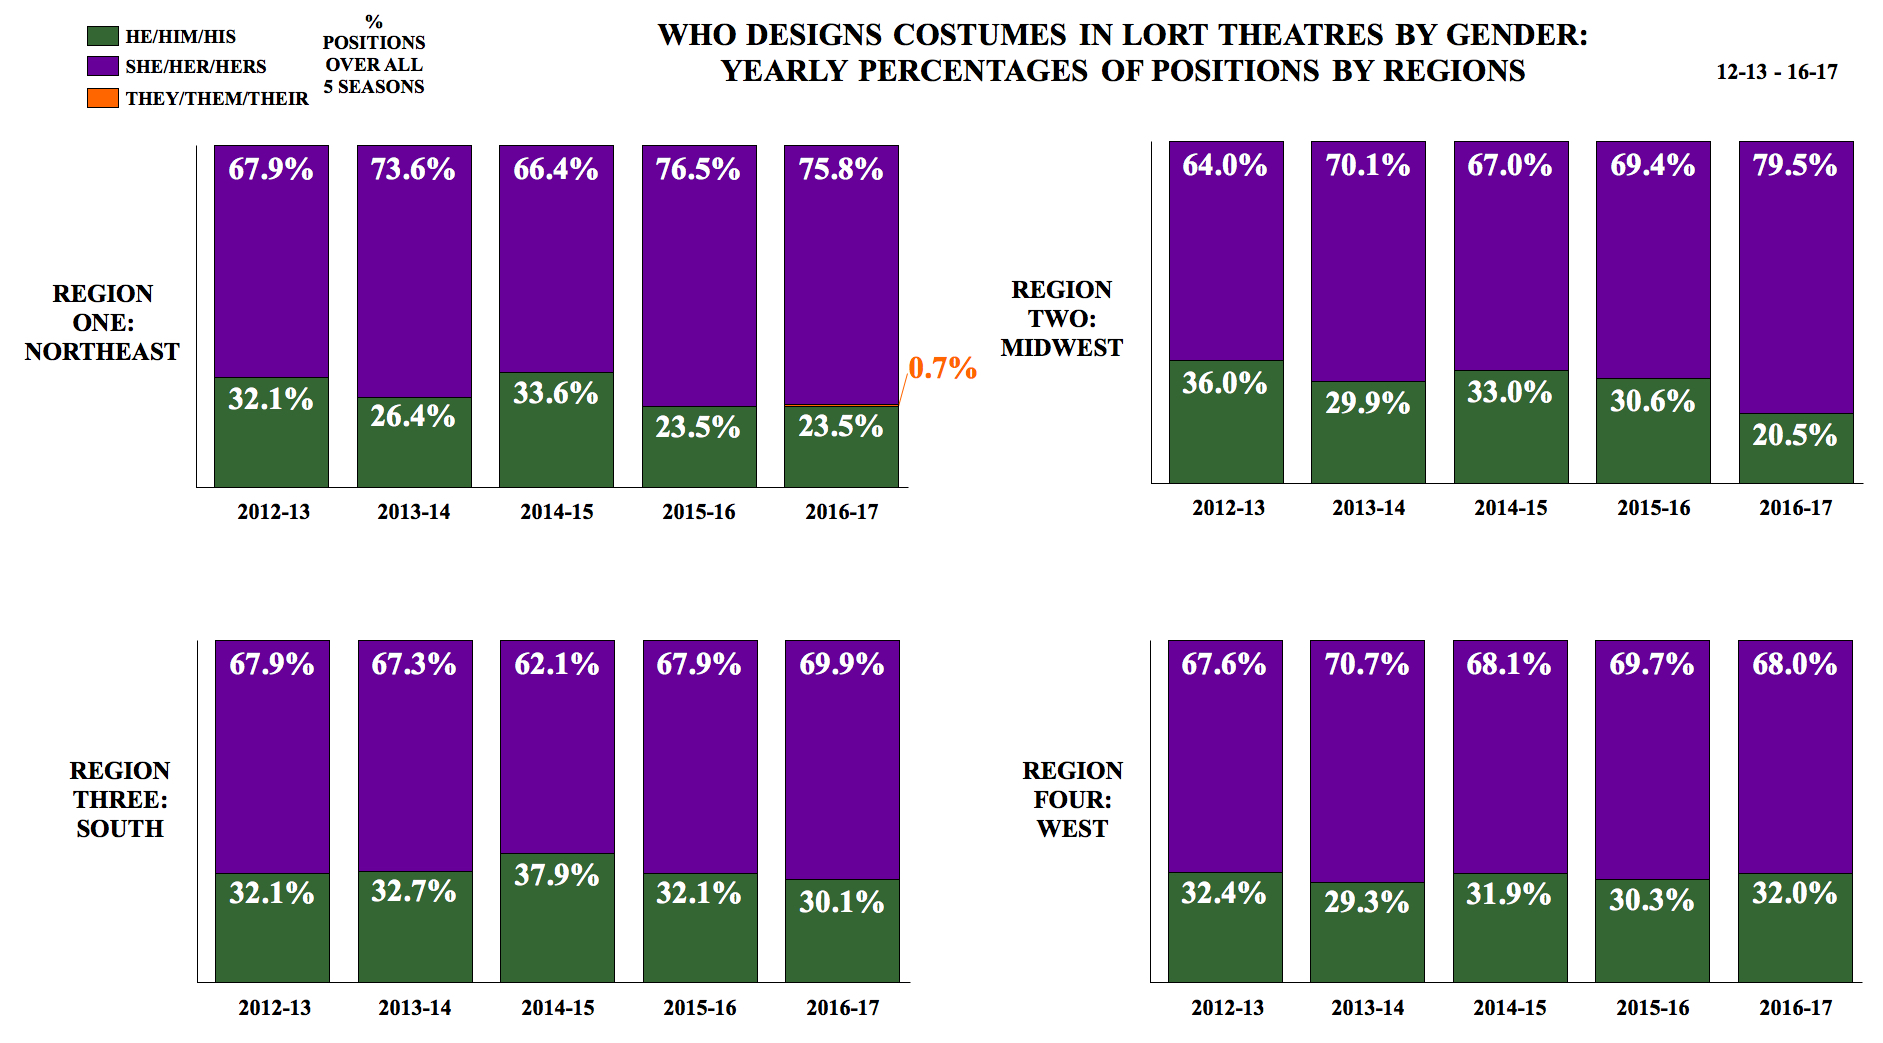
Who Designs Costumes in LORT Theatres by Gender: Yearly Percentages of Positions

In region one, from 2012-13 to 2016-17, she designers went from 67.9 percent to 73.6 percent to 66.4 percent to 76.5 percent to 75.8 percent of all costume design positions filled each season. He designers went from 32.1 percent to 26.4 percent to 33.6 percent to 23.5 percent to 23.5 percent. They designers were at 0.7 percent for the 2016-17 season. Over the five seasons studied, she designers filling costume design positions increased 7.9 percent, and he designers filling costume design positions decreased 8.6 percent.
In region two, from 2012-13 to 2016-17, she designers went from 64.0 percent to 70.1 percent to 67.0 percent to 69.4 percent to 79.5 percent of all costume design positions filled each season. He designers went from 36.0 percent to 29.9 percent to 33.0 percent to 30.6 percent to 20.5 percent. Over the five seasons studied, she designers filling costume design positions increased 15.5 percent, and he designers filling costume design positions decreased 15.5 percent.
In region three, from 2012-13 to 2016-17, she designers went from 67.9 percent to 67.3 percent to 62.1 percent to 67.9 percent to 69.9 percent of all costume design positions filled each season. He designers went from 32.1 percent to 32.7 percent to 37.9 percent to 32.1 percent to 30.1 percent. Over the five seasons studied, she designers filling costume design positions increased 2.0 percent, and he designers filling costume design positions decreased 2.0 percent.
In region four, from 2012-13 to 2016-17, she designers went from 67.6 percent to 70.7 percent to 68.1 percent to 69.7 percent to 68.0 percent of all costume design positions filled each season. He designers went from 32.4 percent to 29.3 percent to 31.9 percent to 30.3 percent to 32.0 percent. Over the five seasons studied, she designers filling costume design positions increased 0.4 percent, and he designers filling costume design positions decreased 0.4 percent.
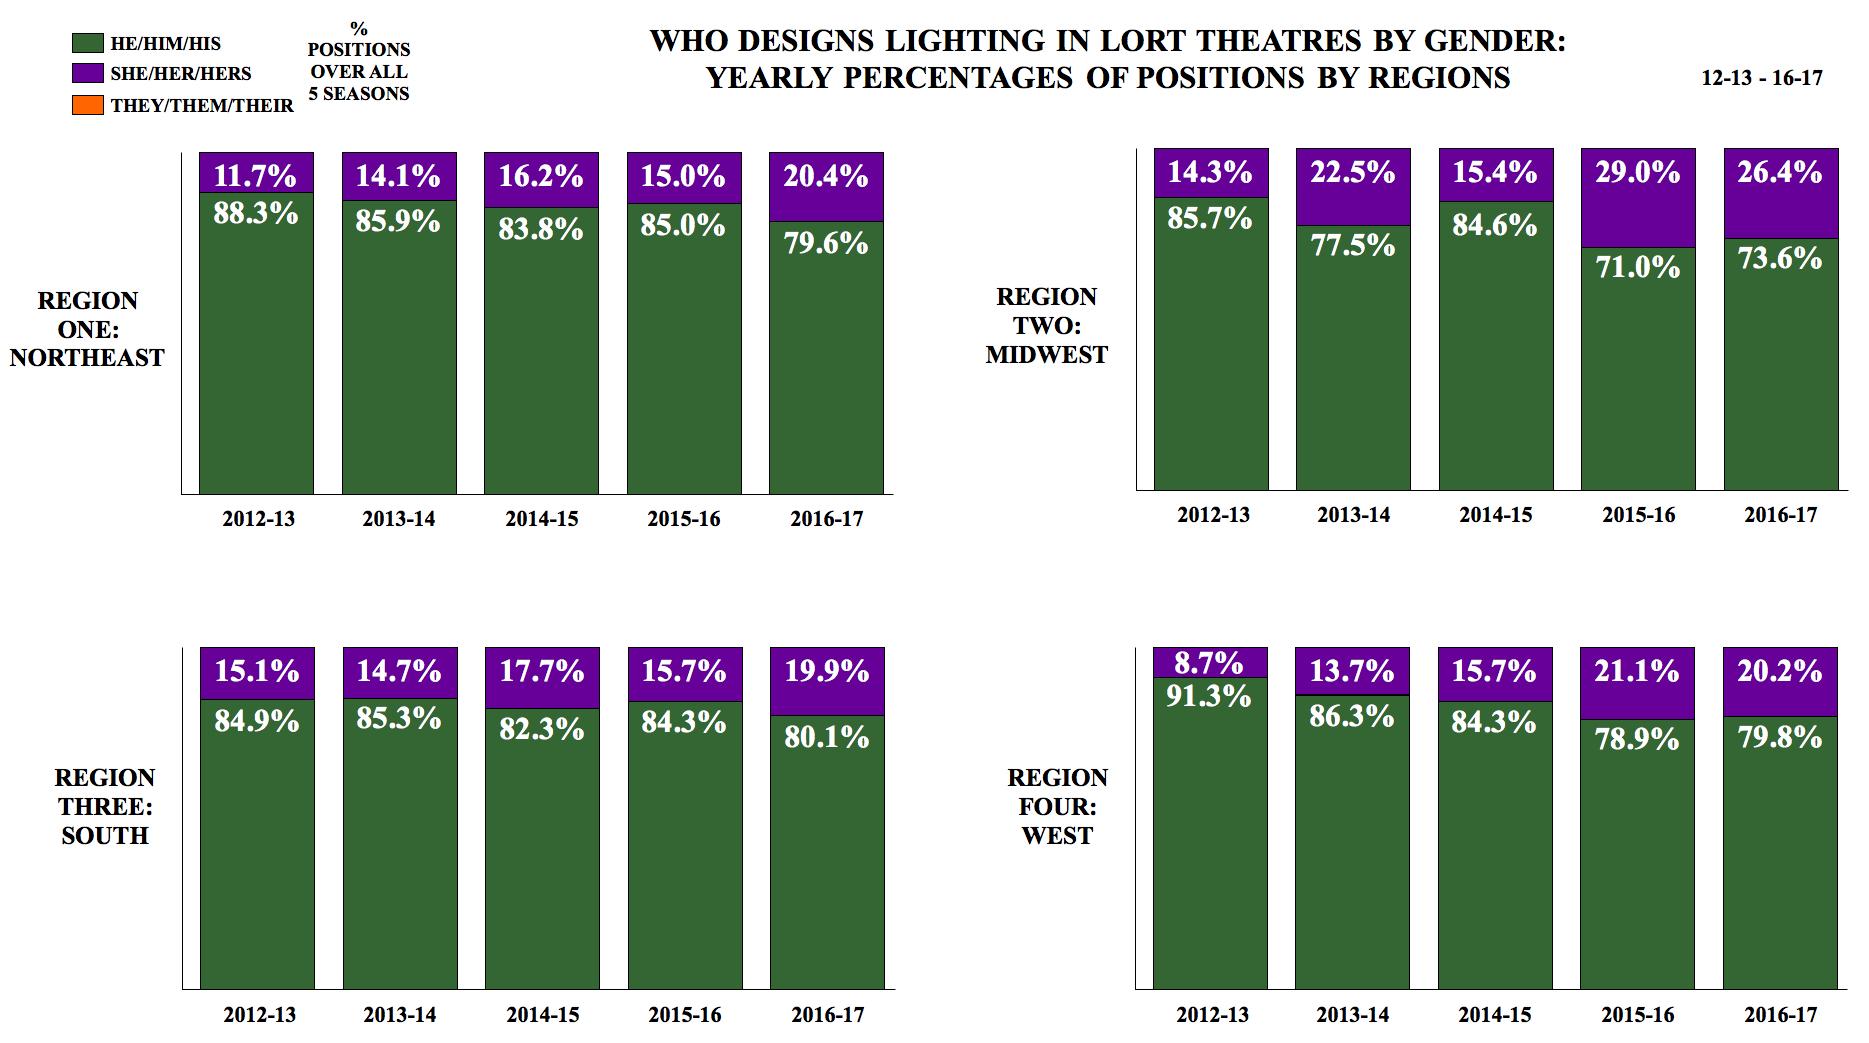
Who Designs Lighting in LORT Theatres by Gender: Yearly Percentages of Positions

In region one, from 2012-13 to 2016-17, he designers went from 88.3 percent to 85.9 percent to 83.8 percent to 85.0 percent to 79.6 percent of all lighting design position filled each season. She designers went from 11.7 percent to 14.1 percent to 16.2 percent to 15.0 percent to 20.4 percent. Over the five seasons studied, he designers filling lighting design positions decreased 8.7 percent, and she designers filling lighting design positions increased 8.7 percent.
In region two, from 2012-13 to 2016-17, he designers went from 85.7 percent to 77.5 percent to 84.6 percent to 71.0 percent to 73.6 percent of all lighting design position filled each season. She designers went from 14.3 percent to 22.5 percent to 15.4 percent to 29.0 percent to 26.4 percent. Over the five seasons studied, he designers filling lighting design positions decreased 12.1 percent, and she designers filling lighting design positions increased 12.1 percent.
In region three, from 2012-13 to 2016-17, he designers went from 84.9 percent to 85.3 percent to 82.3 percent to 84.3 percent to 80.1 percent of all lighting design position filled each season. She designers went from 15.1 percent to 14.7 percent to 17.7 percent to 15.7 percent to 19.9 percent. Over the five seasons studied, he designers filling lighting design positions decreased 4.8 percent, and she designers filling lighting design positions increased 4.8 percent.
In region four, from 2012-13 to 2016-17, he designers went from 91.3 percent to 86.3 percent to 84.3 percent to 78.9 percent to 79.8 percent of all lighting design position filled each season. She designers went from 8.7 percent to 13.7 percent to 15.7 percent to 21.1 percent to 20.2 percent. Over the five seasons studied, he designers filling lighting design positions decreased 11.5 percent, and she designers filling lighting design positions increased 11.5 percent.
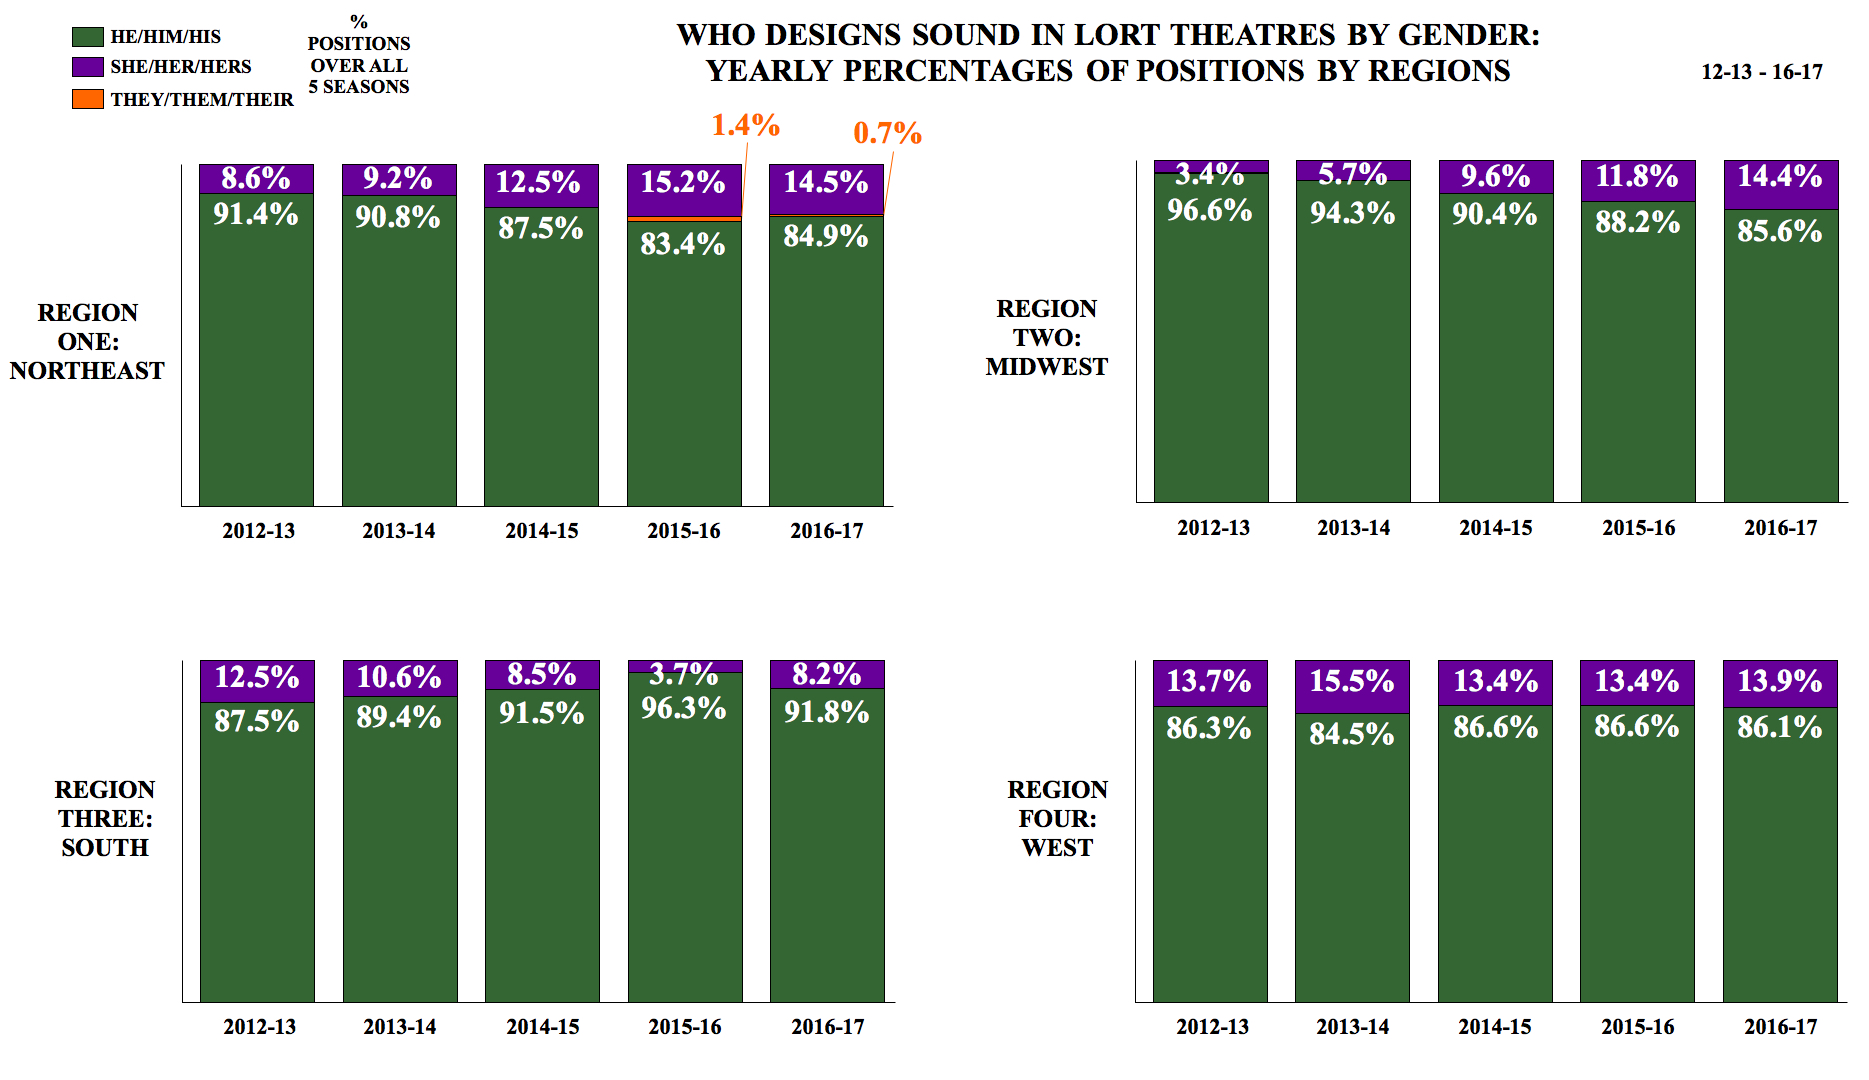
Who Designs Sound in LORT Theatres by Gender: Yearly Percentages of Positions

In region one, from 2012-13 to 2016-17, he designers went from 91.4 percent to 90.8 percent to 87.5 percent to 83.4 percent to 84.9 percent of all sound design positions filled each season. She designers went from 8.6 percent to 9.2 percent to 12.5 percent to 15.2 percent to 14.5 percent. From the 2015-16 to 2016-17 seasons, they designers went from 1.4 percent to 0.7 percent. Over the five seasons studied, he designers filling sound design positions decreased 6.5 percent, and she designers filling sound design positions increased 5.9 percent.
In region two, from 2012-13 to 2016-17, he designers went from 96.6 percent to 94.3 percent to 90.4 percent to 88.2 percent to 85.6 percent of all sound design positions filled each season. She designers went from 3.4 percent to 5.7 percent to 9.6 percent to 11.8 percent to 14.4 percent. Over the five seasons studied, he designers filling sound design positions decreased 11.0 percent, and she designers filling sound design positions increased 11.0 percent.
In region three, from 2012-13 to 2016-17, he designers went from 87.5 percent to 89.4 percent to 91.5 percent to 96.3 percent to 91.8 percent of all sound design positions filled each season. She designers went from 12.5 percent to 10.6 percent to 8.5 percent to 3.7 percent to 8.2 percent. Over the five seasons studied, he designers filling sound design positions increased 4.3 percent, and she designers filling sound design positions decreased 4.3 percent.
In region four, from 2012-13 to 2016-17, he designers went from 86.3 percent to 84.5 percent to 86.6 percent to 86.6 percent to 86.1 percent of all sound design positions filled each season. She designers went from 13.7 percent to 15.5 percent to 13.4 percent to 13.4 percent to 13.9 percent. Over the five seasons studied, he designers filling sound design positions decreased 0.2 percent, and she designers filling sound design positions decreased 0.2 percent.
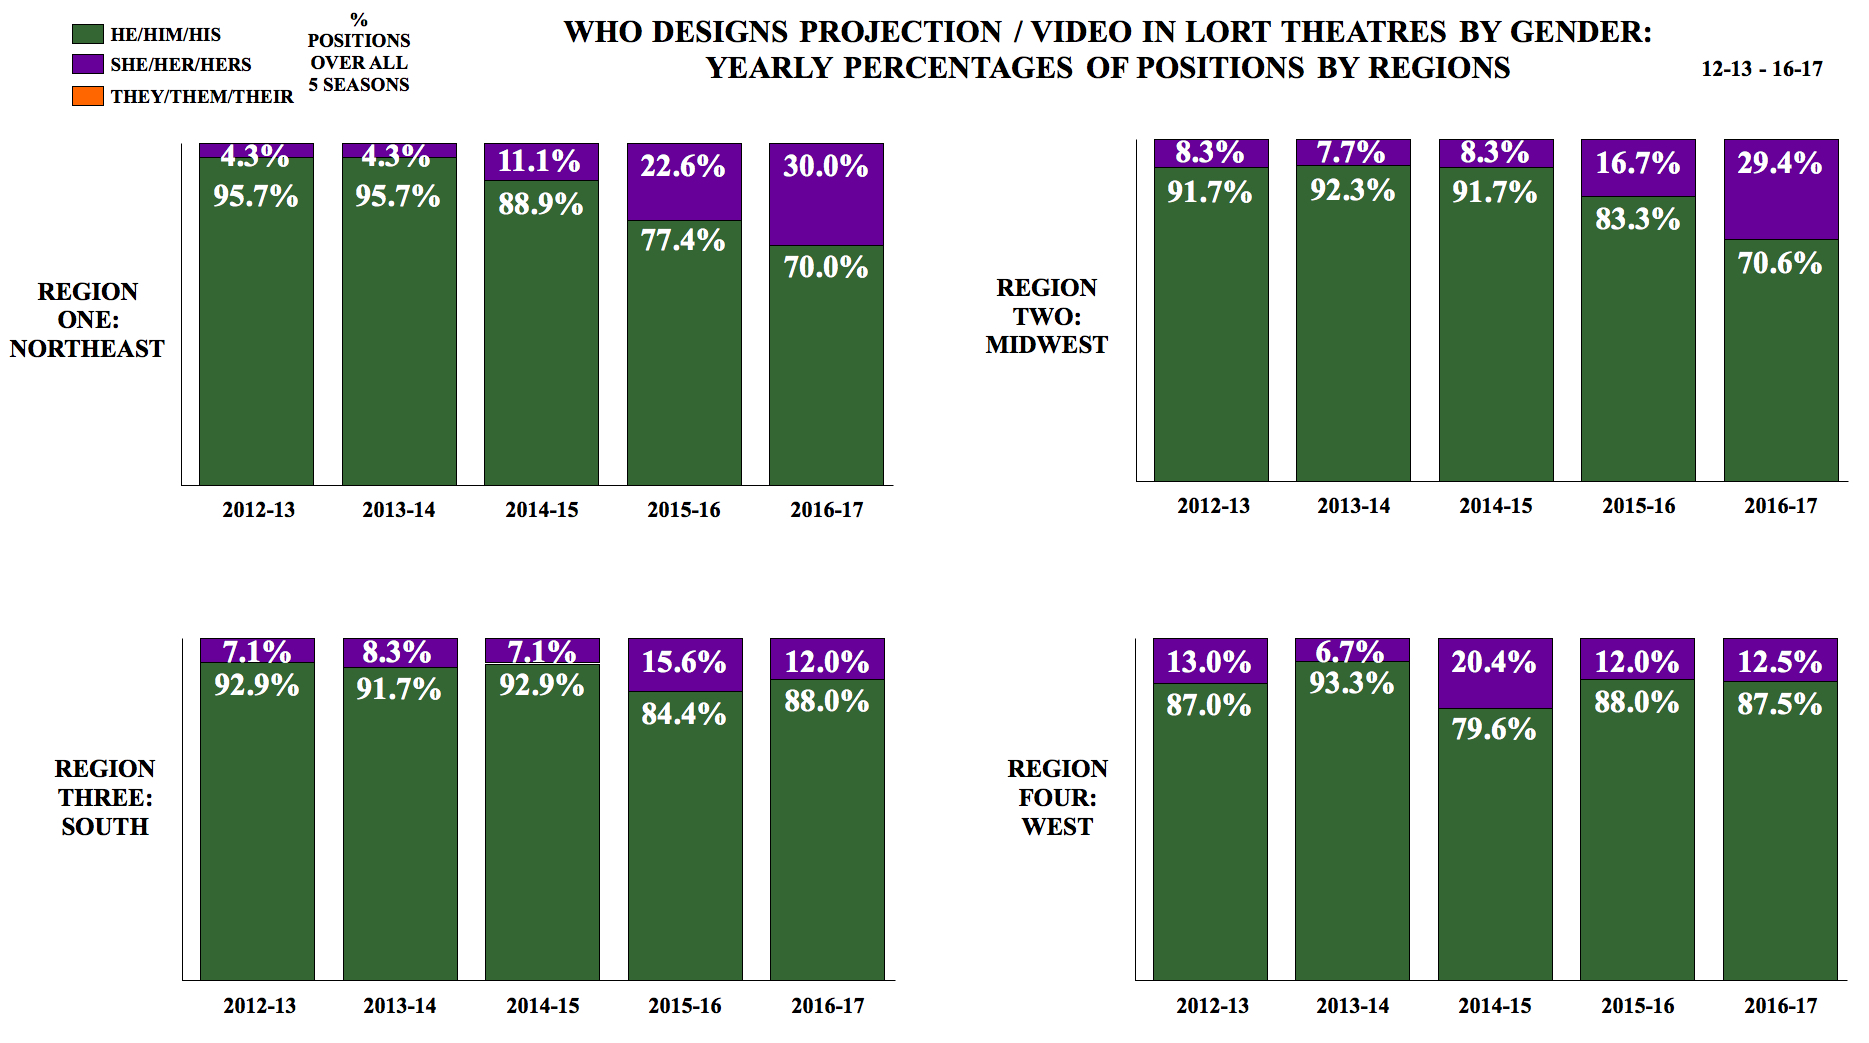
Who Designs Projection/Video in LORT Theatres by Gender: Yearly Percentages of Positions

In region one, from 2012-13 to 2016-17, he designers went from 95.7 percent to 95.7 percent to 88.9 percent to 77.4 percent to 70.0 percent of all projection/video design positions filled each season. She designers went from 4.3 percent to 4.3 percent to 11.1 percent to 22.6 percent to 30.0 percent. Over the five seasons studied, he designers filling projection/video design positions decreased 25.7 percent, and she designers filling projection/video design positions increased 25.7 percent.
In region two, from 2012-13 to 2016-17, he designers went from 91.7 percent to 92.3 percent to 91.7 percent to 83.3 percent to 70.6 percent of all projection/video design positions filled each season. She designers went from 8.3 percent to 7.7 percent to 8.3 percent to 16.7 percent to 29.4 percent. Over the five seasons studied, he designers filling projection/video design positions decreased 21.1 percent, and she designers filling projection/video design positions increased 21.1 percent.
In region three, from 2012-13 to 2016-17, he designers went from 92.9 percent to 91.7 percent to 92.9 percent to 84.4 percent to 88.0 percent of all projection/video design positions filled each season. She designers went from 7.1 percent to 8.3 percent to 7.1 percent to 15.6 percent to 12.0 percent. Over the five seasons studied, he designers filling projection/video design positions decreased 4.9 percent, and she designers filling projection/video design positions increased 4.9 percent.
In region four, from 2012-13 to 2016-17, he designers went from 87.0 percent to 93.3 percent to 79.6 percent to 88.0 percent to 87.5 percent of all projection/video design positions filled each season. She designers went from 13.0 percent to 6.7 percent to 20.4 percent to 12.0 percent to 12.5 percent. Over the five seasons studied, he designers filling projection/video design positions increased 0.5 percent, and she designers filling projection/video design positions decreased 0.5 percent.
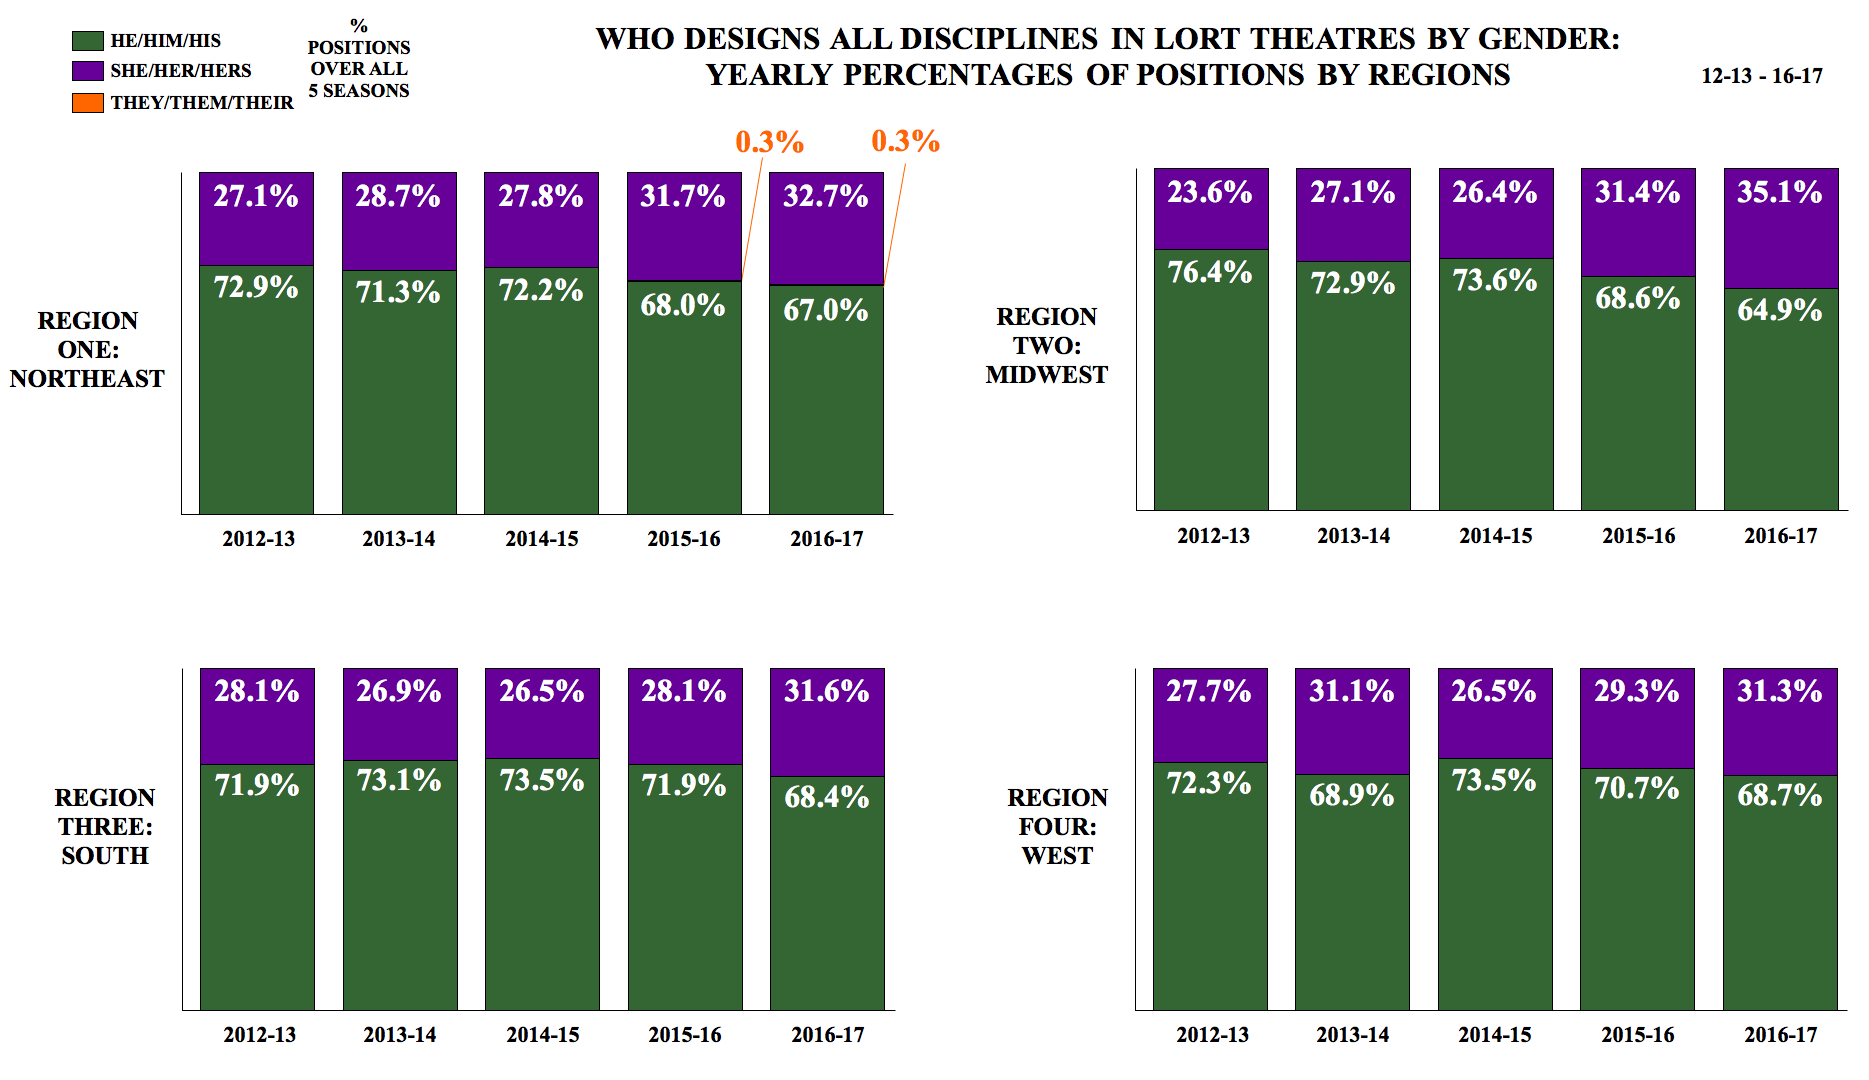
Who Designs all Disciplines in LORT Theatres by Gender: Yearly Percentages of Positions by Regions

In region one, from 2012-13 to 2016-17, he designers went from 72.9 percent to 71.3 percent to 72.2 percent to 68.0 percent to 67.0 percent of all design positions filled. She designers went from 27.1 percent to 28.7 percent to 27.8 percent to 31.7 percent to 32.7 percent. From 2015-16 to 2016-17, they designers remained steady at 0.3 percent. Over the five seasons studied, he designers filling positions decreased 5.9 percent, and she designers filling positions increased 5.6 percent.
In region two, from 2012-13 to 2016-17, he designers went from 76.4 percent to 72.9 percent to 73.6 percent to 68.6 percent to 64.9 percent of all design positions filled. She designers went from 23.6 percent to 27.1 percent to 26.4 percent to 31.4 percent to 35.1 percent. Over the five seasons studied, he designers filling positions decreased 11.5 percent, and she designers filling positions increased 11.5 percent.
In region three, from 2012-13 to 2016-17, he designers went from 71.9 percent to 73.1 percent to 73.5 percent to 71.9 percent to 68.4 percent of all design positions filled. She designers went from 28.1 percent to 26.9 percent to 26.5 percent to 28.1 percent to 31.6 percent. Over the five seasons studied, he designers filling positions decreased 3.5 percent, and she designers filling positions increased 3.5 percent.
In region four, from 2012-13 to 2016-17, he designers went from 72.3 percent to 68.9 percent to 73.5 percent to 70.7 percent to 68.7 percent of all design positions filled. She designers went from 27.7 percent to 31.1 percent to 26.5 percent to 29.3 percent to 31.3 percent. Over the five seasons studied, he designers filling positions decreased 3.6 percent, and she designers filling positions increased 3.6 percent.


Comments
The article is just the start of the conversation—we want to know what you think about this subject, too! HowlRound is a space for knowledge-sharing, and we welcome spirited, thoughtful, and on-topic dialogue. Find our full comments policy here.