
This is the third installment of phase four of this study. Part one contains top-line takeaways and my methodology and part two breaks the data down by geographic regions.
Who Designs and Directs in LORT Theatres by Gender
Phase Four: Part 3
Essay by
Can't wait for the last installment?
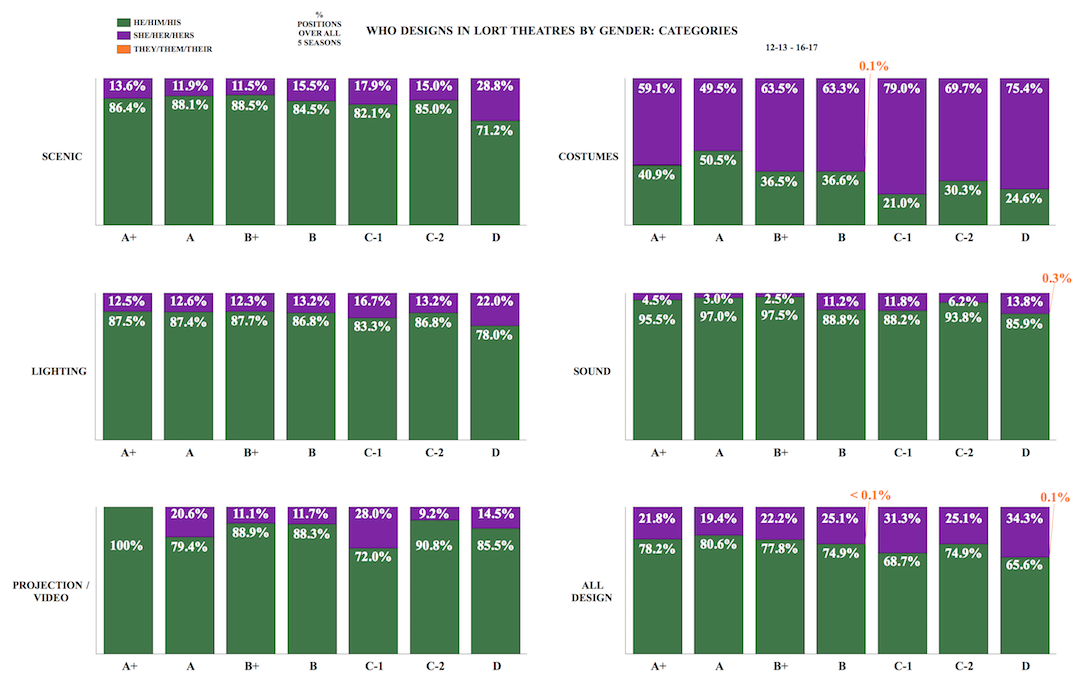
Who Designs in LORT Theatres by Gender: Categories

The following statistics are percentages of positions per LORT Stage Category, as determined by the LORT-AEA agreement (weekly box office receipts and Tony award eligibility) and the LORT-SDC agreement (C category divided into two categories by number of seats, over all five years examined. For more information on minimum rates for designers based on LORT stage categories, visit the United Scene Artists' list of LORT Rates 2017-2022.
In scenic design, 86.4 percent of the 44 positions were filled by he designers, and 13.6 percent by she designers in the A+ category. In the A category, 88.1 percent of the 101 positions were filled by he designers, and 11.9 percent by she designers. 88.5 percent of the 122 positions were filled by he designers, and 11.5 percent by she designers in the B+ category. In the B category, 84.5 percent of the 796 positions were filled by he designers, and 15.5 percent by she designers. 82.1 percent of the 168 positions were filled by he designers, and 17.9 percent by she designers in the C-1 category. In the C-2 category, 85.0 percent of the 256 positions were filled by he designers, and 15.0 percent by she designers. In the D category, 71.2 percent of the 1116 positions were filled by he designers, and 28.8 percent by she designers.
In costume design, 59.1 percent of the 44 positions were filled by she designers, and 40.9 percent by he designers in the A+ category. In the A category, 50.5 percent of the 102 positions were filled by he designers, and 49.5 percent by she designers. 63.5 percent of the 122 positions were filled by she designers, and 36.5 percent by he designers in the B+ category. In the B category, 63.3 percent of the 790 positions were filled by she designers, 36.6 percent by he designers, and 0.1 percent by they designers. 79.0 percent of the 167 positions were filled by she designers, and 21.0 percent by he designers in the C-1 category. In the C-2 category, 69.7 percent of the 251 positions were filled by she designers, and 30.3 percent by he designers. In the D category, 75.4 percent of the 1095 positions were filled by she designers, and 24.6 percent by he designers.
In lighting design, 87.5 percent of the 44 positions were filled by he designers, and 12.5 percent by she designers in the A+ category. In the A category, 87.4 percent of the 103 positions were filled by he designers, and 12.6 percent by she designers. 87.7 percent of the 122 positions were filled by he designers, and 12.3 percent by she designers in the B+ category. In the B category, 86.8 percent of the 796 positions were filled by he designers, and 13.2 percent by she designers. 83.3 percent of the 168 positions were filled by he designers, and 16.7 percent by she designers in the C-1 category. In the C-2 category, 86.8 percent of the 258 positions were filled by he designers, and 13.2 percent by she designers. In the D category, 78.0 percent of the 1122 positions were filled by he designers, and 22.0 percent by she designers.
In sound design, 95.5 percent of the 44 positions were filled by he designers, and 5.5 percent by she designers in the A+ category. In the A category, 97.0 percent of 100 positions were filled by he designers, and 3.0 percent by she designers. 97.5 percent of the 118 positions were filled by he designers, and 2.5 percent by she designers in the B+ category. In the B category, 88.8 percent of the 786 positions were filled by he designers, and 11.2 percent by she designers. 88.2 percent of the 161 positions were filled by he designers, and 11.8 percent by she designers in the C-1 category. In the C-2 category, 93.8 percent of the 251 positions were filled by he designers, and 6.2 percent by she designers. In the D category, 85.9 percent of the 1049 positions were filled by he designers, 13.8 percent by she designers, and 0.3 percent by they designers.
In projection/video design, 100.0 percent of the 5 positions were filled by he designers in the A+ category. In the A category, 79.4 percent of 17 positions were filled by he designers, and 20.6 percent by she designers. 88.9 percent of 18 positions were filled by he designers, and 11.1 percent by she designers in the B+ category. In the B category, 88.3 percent of the 162 positions were filled by he designers, and 11.7 percent by she designers. 72.0 percent of the 25 positions were filled by he designers, and 28.0 percent by she designers in the C-1 category. In the C-2 category, 90.8 percent of the 49 positions were filled by he designers, and 9.2 percent by she designers. In the D category, 85.5 percent of 173 positions were filled by he designers, and 14.5 percent by she designers.
In all design, 78.2 percent of the 181 positions were filled by he designers, and 21.8 percent by she designers in the A+ category. In the A category, 80.6 percent of the 423 positions were filled by he designers, and 19.4 percent by she designers. 77.8 percent of 502 positions were filled by he designers, and 22.2 percent by she designers in the B+ category. In the B category, 74.9 percent of the 3330 positions were filled by he designers, 25.1 percent by she designers, and less than 0.1 percent by they designers. 68.7 percent of the 689 positions were filled by he designers, and 31.3 percent by she designers in the C-1 category. In the C-2 category, 74.9 percent of the 1065 positions were filled by he designers, and 25.1 percent by she designers. In the D category, 65.6 percent of the 4555 positions were filled by he designers, 34.3 percent by she designers, and 0.1 percent by they designers.
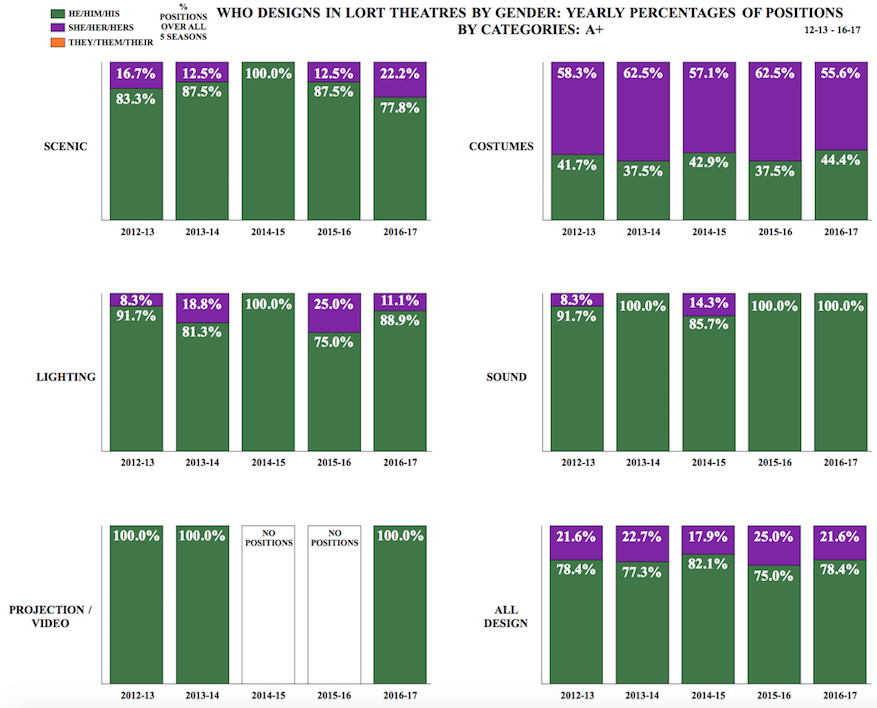
Who Designs in LORT Theatres by Gender: Yearly Percentages of Positions by Categories: A+

Note: In all five seasons combined, there are only 44 productions total.
In the A+ category from 2012-13 to 2016-17, he designers went from 83.3 percent to 87.5 percent to 100.0 percent to 87.5 percent to 77.8 percent of all scenic design positions filled each season. She designers went from 16.7 percent to 12.5 percent to 0.0 percent to 12.5 percent to 22.2 percent of all scenic design positions filled each season. Over the five seasons studied, he designers filling scenic design positions decreased 5.5 percent, while she designers filling scenic design positions increased 5.5 percent.
In the A+ category from 2012-13 to 2016-17, she designers went from 58.3 percent to 62.5 percent to 57.1 percent to 62.5 percent to 55.6 percent of all costume design positions filled each season. He designers went from 41.7 percent to 37.5 percent to 42.9 percent to 37.5 percent to 44.4 percent. Over the five seasons studied, she designers filling costume design positions decreased 2.7 percent, and he designers filling costume design positions increased 2.7 percent.
In the A+ category from 2012-13 to 2016-17, he designers went from 91.7 percent to 81.3 percent to 100.0 percent to 75.0 percent to 88.9 percent of all lighting design position filled each season. She designers went from 8.1 percent to 18.8 percent to 0.0 percent to 25.0 percent to 11.1 percent. Over the five seasons studied, he designers filling lighting design positions decreased 2.8 percent, and she designers filling lighting design positions increased 2.8 percent.
In the A+ category from 2012-13 to 2016-17, he designers went from 91.7 percent to 100.0 percent to 85.7 percent to 100.0 percent to 100.0 percent of all sound design positions filled each season. She designers went from 8.3 percent to 0.0 percent to 14.3 percent to 0.0 percent to 0.0 percent. Over the five seasons studied, he designers filling sound design positions increased 8.3 percent, and she designers filling sound design positions decreased 8.3 percent.
In the A+ category from 2012-13 to 2016-17, he designers went from 100.0 percent to 100.0 percent to no positions for two seasons to 100.0 percent of all projection/video design positions filled each season. She designers went from 0.0 percent to 0.0 percent to no positions for two seasons to 0.0 percent. Over the five seasons studied, he designers filling projection/video design positions remained steady at 100.0 percent of the positions.
In the A+ category from 2012-13 to 2016-17, he designers went from 78.4 percent to 77.3 percent to 82.1 percent to 75.0 percent to 78.4 percent of all design positions filled. She designers went from 21.6 percent to 22.7 percent to 17.9 percent to 25.0 percent to 21.6 percent. Over the five seasons studied, he designers filling positions remained steady at 78.4 percent, and she designers filling positions remained steady at 21.6 percent.
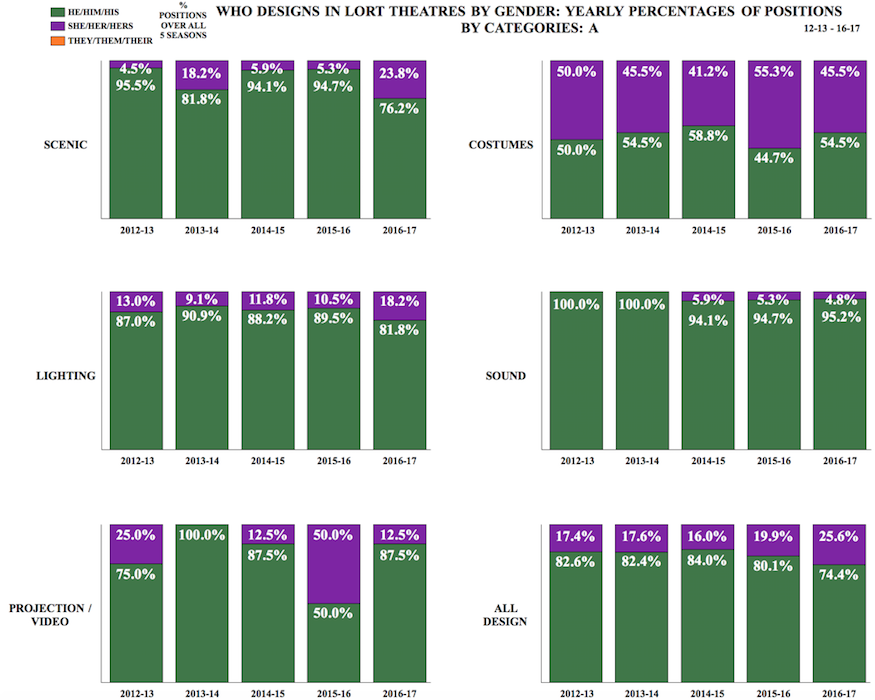
Who Designs in LORT Theatres by Gender: Yearly Percentages of Positions by Categories: A

Note: In all five seasons combined, there are only 103 productions total.
In the A category from 2012-13 to 2016-17, he designers went from 95.5 percent to 81.8 percent to 94.1 percent to 94.7 percent to 76.2 percent of all scenic design positions filled each season. She designers went from 4.5 percent to 18.2 percent to 5.9 percent to 5.3 percent to 23.8 percent of all scenic design positions filled each season. Over the five seasons studied, he designers filling scenic design positions decreased 19.3 percent, while she designers filling scenic design positions increased 19.3 percent.
In the A category from 2012-13 to 2016-17, she designers went from 50.0 percent to 45.5 percent to 41.2 percent to 55.3 percent to 45.5 percent of all costume design positions filled each season. He designers went from 50.0 percent to 54.5 percent to 58.8 percent to 44.7 percent to 54.5 percent. Over the five seasons studied, she designers filling costume design positions decreased 4.5 percent, and he designers filling costume design positions increased 4.5 percent.
In the A category from 2012-13 to 2016-17, he designers went from 87.0 percent to 90.9 percent to 88.2 percent to 89.5 percent to 81.8 percent of all lighting design position filled each season. She designers went from 13.0 percent to 9.1 percent to 11.8 percent to 10.5 percent to 18.2 percent. Over the five seasons studied, he designers filling lighting design positions decreased 5.2 percent, and she designers filling lighting design positions increased 5.2 percent.
In the A category from 2012-13 to 2016-17, he designers went from 100.0 percent to 100.0 percent to 94.1 percent to 94.7 percent to 95.2 percent of all sound design positions filled each season. She designers went from 0.0 percent to 0.0 percent to 5.9 percent to 5.3 percent to 4.8 percent. Over the five seasons studied, he designers filling sound design positions decreased 4.8 percent, and she designers filling sound design positions increased 4.8 percent.
In the A category from 2012-13 to 2016-17, he designers went from 75.0 percent to 100.0 percent to 87.5 percent to 50.0 percent to 12.5 percent of all projection/video design positions filled each season. She designers went from 25.0 percent to 0.0 percent to 12.5 percent to 50.0 percent to 12.5 percent. Over the five seasons studied, he designers filling projection/video design positions increased 12.5 percent, and she designers filling projection/video design positions decreased 12.5 percent.
In the A category from 2012-13 to 2016-17, he designers went from 82.6 percent to 82.4 percent to 84.0 percent to 80.1 percent to 74.4 percent of all design positions filled. She designers went from 17.4 percent to 17.6 percent to 16.0 percent to 19.9 percent to 25.6 percent. Over the five seasons studied, he designers filling positions decreased 8.2 percent, and she designers filling positions increased 8.2 percent.
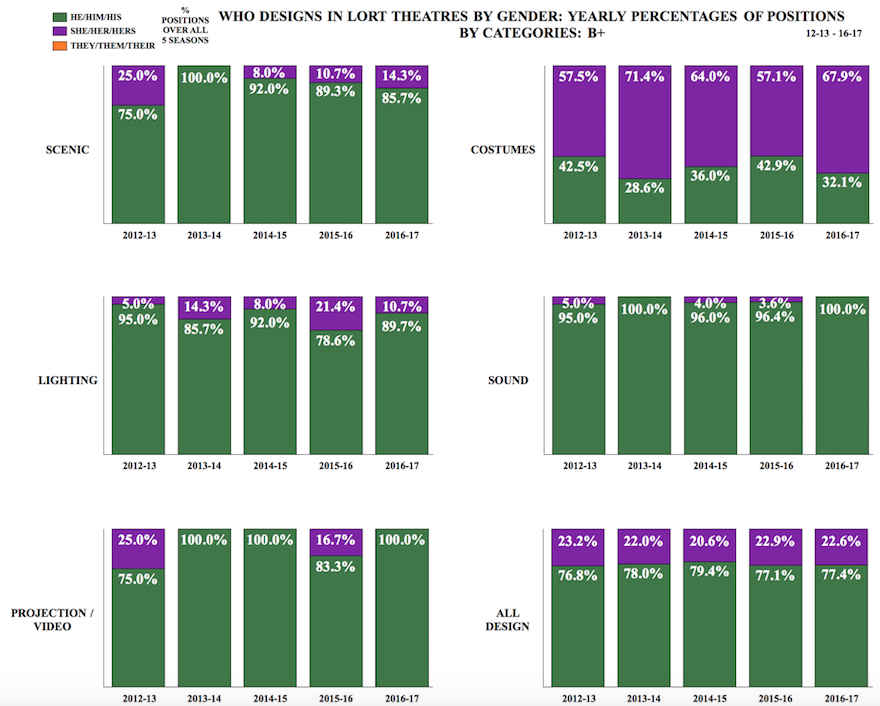
Who Designs in LORT Theatres by Gender: Yearly Percentages of Position by Categories: B+

Note: In all five seasons combined, there are only 121 productions total.
In the B+ category from 2012-13 to 2016-17, he designers went from 75.0 percent to 100.0 percent to 92.0 percent to 89.3 percent to 85.7 percent of all scenic design positions filled each season. She designers went from 25.0 percent to 0.0 percent to 8.0 percent to 10.7 percent to 14.3 percent of all scenic design positions filled each season. Over the five seasons studied, he designers filling scenic design positions increased 10.7 percent, while she designers filling scenic design positions decreased 10.7 percent.
In the B+ category from 2012-13 to 2016-17, she designers went from 57.5 percent to 71.4 percent to 64.0 percent to 57.1 percent to 67.9 percent of all costume design positions filled each season. He designers went from 42.5 percent to 28.6 percent to 36.0 percent to 42.9 percent to 32.1 percent. Over the five seasons studied, she designers filling costume design positions increased 10.4 percent, and he designers filling costume design positions decreased 10.4 percent.
In the B+ category from 2012-13 to 2016-17, he designers went from 95.0 percent to 85.7 percent to 92.0 percent to 78.6 percent to 89.7 percent of all lighting design position filled each season. She designers went from 5.0 percent to 14.3 percent to 8.0 percent to 21.4 percent to 10.7 percent. Over the five seasons studied, he designers filling lighting design positions decreased 5.7 percent, and she designers filling lighting design positions increased 5.7 percent.
In the B+ category from 2012-13 to 2016-17, he designers went from 95.0 percent to 100.0 percent to 96.0 percent to 96.4 percent to 100.0 percent of all sound design positions filled each season. She designers went from 5.0 percent to 0.0 percent to 4.0 percent to 3.6 percent to 0.0 percent. Over the five seasons studied, he designers filling sound design positions increased 5.0 percent, and she designers filling sound design positions decreased 5.0 percent.
In the B+ category from 2012-13 to 2016-17, he designers went from 75.0 percent to 100.0 percent to 100.0 percent to 83.3 percent to 100.0 percent of all projection/video design positions filled each season. She designers went from 25.0 percent to 0.0 percent to 0.0 percent to 16.7 percent to 0.0 percent. Over the five seasons studied, he designers filling projection/video design positions increased 25.0 percent, and she designers filling projection/video design positions decreased 25.0 percent.
In the B+ category from 2012-13 to 2016-17, he designers went from 76.8 percent to 78.0 percent to 79.4 percent to 77.1 percent to 77.4 percent of all design positions filled. She designers went from 23.2 percent to 22.0 percent to 20.6 percent to 22.9 percent to 22.6 percent. Over the five seasons studied, he designers filling positions increased 0.6 percent, and she designers filling positions decreased 0.6 percent.
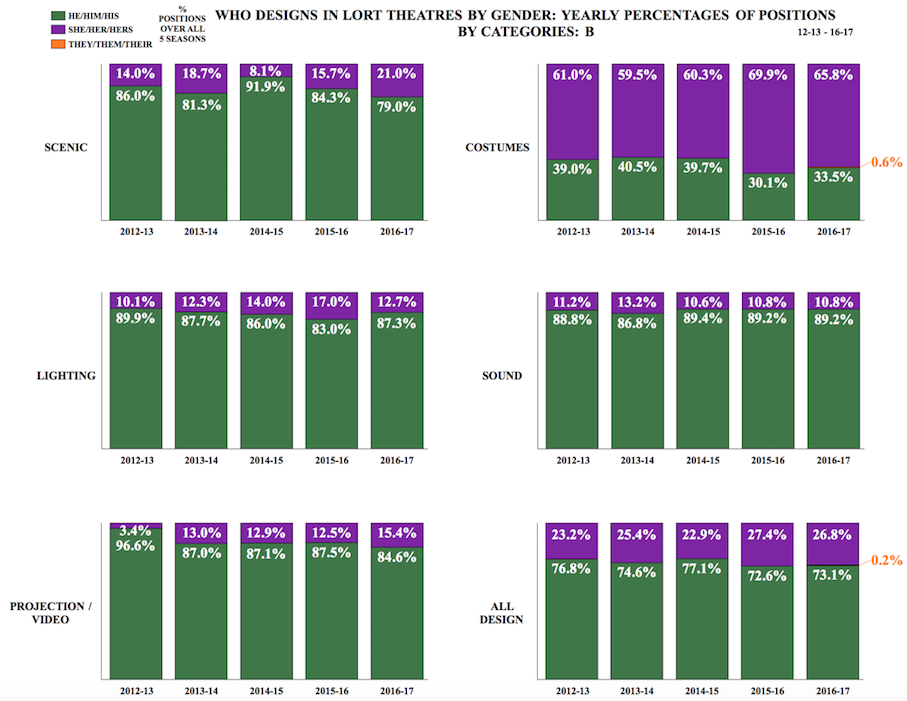
Who Designs in LORT Theatres by Gender: Yearly Percentages of Positions by Categories: B

In the B category from 2012-13 to 2016-17, he designers went from 86.0 percent to 81.3 percent to 91.9 percent to 84.3 percent to 79.0 percent of all scenic design positions filled each season. She designers went from 14.0 percent to 18.7 percent to 8.1 percent to 15.7 percent to 21.0 percent of all scenic design positions filled each season. Over the five seasons studied, he designers filling scenic design positions decreased 7.0 percent, while she designers filling scenic design positions increased 7.0 percent.
In the B category from 2012-13 to 2016-17, she designers went from 61.0 percent to 59.5 percent to 60.3 percent to 69.9 percent to 65.8 percent of all costume design positions filled each season. He designers went from 39.0 percent to 40.5 percent to 39.7 percent to 30.1 percent to 33.5 percent. In 2016-17, they designers filled 0.6% of all costume design positions filled that season. Over the five seasons studied, she designers filling costume design positions increased 4.8 percent, and he designers filling costume design positions decreased 5.5 percent.
In the B category from 2012-13 to 2016-17, he designers went from 89.9 percent to 87.7 percent to 86.0 percent to 83.0 percent to 87.3 percent of all lighting design position filled each season. She designers went from 10.1 percent to 12.3 percent to 14.0 percent to 17.0 percent to 12.7 percent. Over the five seasons studied, he designers filling lighting design positions decreased 2.6 percent, and she designers filling lighting design positions increased 2.6 percent.
In the B category from 2012-13 to 2016-17, he designers went from 88.8 percent to 86.8 percent to 89.4 percent to 89.2 percent to 89.2 percent of all sound design positions filled each season. She designers went from 11.2 percent to 13.2 percent to 10.6 percent to 10.8 percent to 10.8 percent. Over the five seasons studied, he designers filling sound design positions increased 0.4 percent, and she designers filling sound design positions decreased 0.4 percent.
In the B category from 2012-13 to 2016-17, he designers went from 96.6 percent to 87.0 percent to 87.1 percent to 87.5 percent to 84.6 percent of all projection/video design positions filled each season. She designers went from 3.4 percent to 13.0 percent to 12.9 percent to 12.5 percent to 15.4 percent. Over the five seasons studied, he designers filling projection/video design positions decreased 12.0 percent, and she designers filling projection/video design positions increased 12.0 percent.
In the B category from 2012-13 to 2016-17, he designers went from 76.8 percent to 74.6 percent to 77.1 percent to 72.6 percent to 73.1 percent of all design positions filled. She designers went from 23.2 percent to 25.4 percent to 22.9 percent to 27.4 percent to 26.8 percent. In 2016-17, they designers filled 0.2 percent of all design positions filled. Over the five seasons studied, he designers filling positions decreased 3.7 percent, and she designers filling positions increased 3.6 percent.
Who Designs in LORT Theatres: Yearly Percentages of Positions by Categories: C-1

In the C-1 category from 2012-13 to 2016-17, he designers went from 76.0 percent to 88.9 percent to 91.3 percent to 75.0 percent to 80.8 percent of all scenic design positions filled each season. She designers went from 24.0 percent to 11.1 percent to 8.7 percent to 25.0 percent to 19.2 percent of all scenic design positions filled each season. Over the five seasons studied, he designers filling scenic design positions increased 4.8 percent, while she designers filling scenic design positions decreased 4.8 percent.
In the C-1 category from 2012-13 to 2016-17, she designers went from 72.0 percent to 86.7 percent to 73.9 percent to 87.5 percent to 76.0 percent of all costume design positions filled each season. He designers went from 28.0 percent to 13.3 percent to 26.1 percent to 12.5 percent to 24.0 percent. Over the five seasons studied, she designers filling costume design positions increased 4.0 percent, and he designers filling costume design positions decreased 4.0 percent.
In the C-1 category from 2012-13 to 2016-17, he designers went from 90.0 percent to 84.4 percent to 78.3 percent to 83.3 percent to 73.1 percent of all lighting design position filled each season. She designers went from 10.0 percent to 15.6 percent to 21.7 percent to 16.7 percent to 26.9 percent. Over the five seasons studied, he designers filling lighting design positions decreased 16.9 percent, and she designers filling lighting design positions increased 16.9 percent.
In the C-1 category from 2012-13 to 2016-17, he designers went from 87.5 percent to 83.7 percent to 85.7 percent to 87.0 percent to 100.0 percent of all sound design positions filled each season. She designers went from 12.5 percent to 16.3 percent to 14.3 percent to 13.0 percent to 0.0 percent. Over the five seasons studied, he designers filling sound design positions increased 12.5 percent, and she designers filling sound design positions decreased 12.5 percent.
In the C-1 category from 2012-13 to 2016-17, he designers went from 100.0 percent to 87.5 percent to 66.7 percent to 50.0 percent to 0.0 percent of all projection/video design positions filled each season. She designers went from 0.0 percent to 12.5 percent to 33.3 percent to 50.0 percent to 100.0 percent. Over the five seasons studied, he designers filling projection/video design positions decreased 100.0 percent, and she designers filling projection/video design positions increased 100.0 percent.
In the C-1 category from 2012-13 to 2016-17, he designers went from 71.2 percent to 68.3 percent to 69.9 percent to 63.6 percent to 67.9 percent of all design positions filled. She designers went from 28.8 percent to 31.7 percent to 30.1 percent to 36.4 percent to 32.1 percent. Over the five seasons studied, he designers filling positions decreased 3.3 percent, and she designers filling positions increased 3.3 percent.
Who Designs in LORT Theatres by Gender: Yearly Percentages of Positions by Categories: C-2

In the C-2 category from 2012-13 to 2016-17, he designers went from 89.4 percent to 81.0 percent to 92.3 percent to 85.7 percent to 76.0 percent of all scenic design positions filled each season. She designers went from 10.6 percent to 19.0 percent to 7.7 percent to 14.3 percent to 24.0 percent of all scenic design positions filled each season. Over the five seasons studied, he designers filling scenic design positions decreased 13.4 percent, while she designers filling scenic design positions increased 13.4 percent.
In the C-2 category from 2012-13 to 2016-17, she designers went from 66.0 percent to 78.6 percent to 66.0 percent to 66.1 percent to 74.0 percent of all costume design positions filled each season. He designers went from 34.0 percent to 21.4 percent to 34.0 percent to 33.9 percent to 26.0 percent. Over the five seasons studied, she designers filling costume design positions increased 8.0 percent, and he designers filling costume design positions decreased 8.0 percent.
In the C-2 category from 2012-13 to 2016-17, he designers went from 89.4 percent to 90.5 percent to 88.7 percent to 84.4 percent to 82.7 percent of all lighting design position filled each season. She designers went from 10.6 percent to 9.5 percent to 11.3 percent to 15.6 percent to 17.3 percent. Over the five seasons studied, he designers filling lighting design positions decreased 6.7 percent, and she designers filling lighting design positions increased 6.7 percent.
In the C-2 category from 2012-13 to 2016-17, he designers went from 91.3 percent to 97.6 percent to 96.1 percent to 93.5 percent to 90.7 percent of all sound design positions filled each season. She designers went from 8.7 percent to 2.4 percent to 3.9 percent to 6.5 percent to 9.3 percent. Over the five seasons studied, he designers filling sound design positions increased 0.6 percent, and she designers filling sound design positions decreased 0.6 percent.
In the C-2 category from 2012-13 to 2016-17, he designers went from 91.7 percent to 100.0 percent to 100.0 percent to 81.3 percent to 90.0 percent of all projection/video design positions filled each season. She designers went from 8.3 percent to 0.0 percent to 0.0 percent to 18.8 percent to 10.0 percent. Over the five seasons studied, he designers filling projection/video design positions decreased 1.7 percent, and she designers filling projection/video design positions increased 1.7 percent.
In the C-2 category from 2012-13 to 2016-17, he designers went from 76.4 percent to 73.7 percent to 79.2 percent to 74.9 percent to 70.0 percent of all design positions filled. She designers went from 23.6 percent to 26.3 percent to 20.8 percent to 25.1 percent to 30.0 percent. Over the five seasons studied, he designers filling positions decreased 6.4 percent, and she designers filling positions increased 6.4 percent.
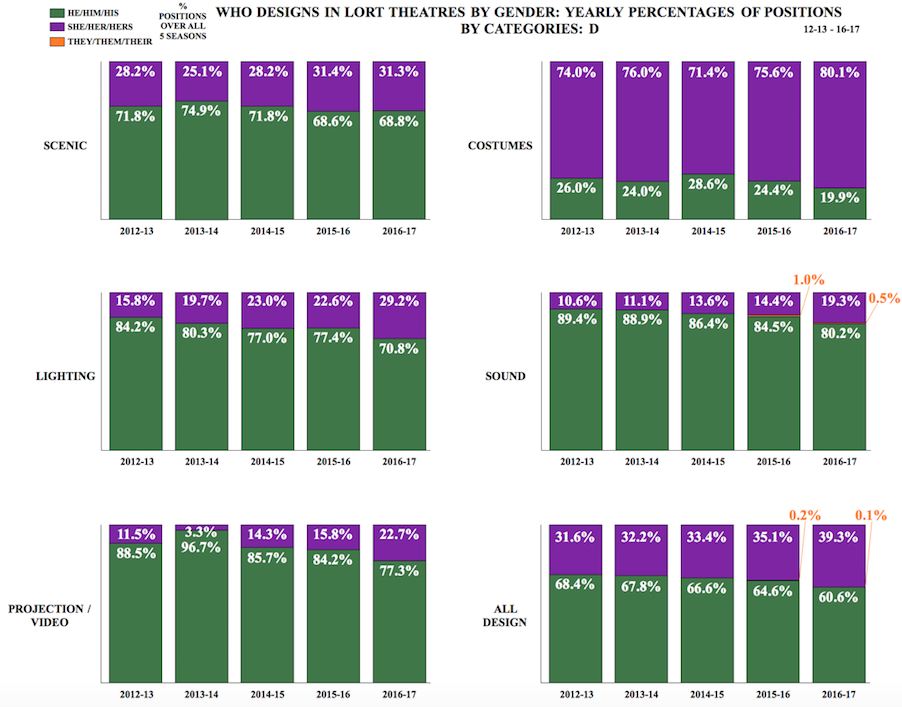
Who Designs in LORT Theatres by Gender: Yearly Percentages of Positions by Category: D

In the D category from 2012-13 to 2016-17, he designers went from 71.8 percent to 74.9 percent to 71.8 percent to 68.6 percent to 68.8 percent of all scenic design positions filled each season. She designers went from 28.2 percent to 25.1 percent to 28.2 percent to 31.4 percent to 31.3 percent of all scenic design positions filled each season. Over the five seasons studied, he designers filling scenic design positions decreased 3.0 percent, while she designers filling scenic design positions increased 3.1 percent.
In the D category from 2012-13 to 2016-17, she designers went from 74.0 percent to 76.0 percent to 71.4 percent to 75.6 percent to 80.1 percent of all costume design positions filled each season. He designers went from 26.0 percent to 24.0 percent to 28.6 percent to 24.4 percent to 19.9 percent. Over the five seasons studied, she designers filling costume design positions increased 6.1 percent, and he designers filling costume design positions decreased 6.1 percent.
In the D category from 2012-13 to 2016-17, he designers went from 84.2 percent to 80.3 percent to 77.0 percent to 77.4 percent to 70.8 percent of all lighting design position filled each season. She designers went from 15.8 percent to 19.7 percent to 23.0 percent to 22.6 percent to 29.2 percent. Over the five seasons studied, he designers filling lighting design positions decreased 13.4 percent, and she designers filling lighting design positions increased 13.4 percent.
In the D category from 2012-13 to 2016-17, he designers went from 89.4 percent to 88.9 percent to 86.4 percent to 84.5 percent to 80.2 percent of all sound design positions filled each season. She designers went from 10.6 percent to 11.1 percent to 13.6 percent to 14.4 percent to 19.3 percent. From 2015-16 to 2016-17, they designers went from 1.0 percent to 0.5 percent of all sound design positions filled each season. Over the five seasons studied, he designers filling sound design positions decreased 9.2 percent, and she designers filling sound design positions increased 8.7 percent.
In the D category from 2012-13 to 2016-17, he designers went from 88.5 percent to 96.7 percent to 85.7 percent to 84.2 percent to 77.3 percent of all projection/video design positions filled each season. She designers went from 11.5 percent to 3.3 percent to 14.3 percent to 15.8 percent to 22.7 percent. Over the five seasons studied, he designers filling projection/video design positions decreased 11.2 percent, and she designers filling projection/video design positions increased 11.2 percent.
In the D category from 2012-13 to 2016-17, he designers went from 68.4 percent to 67.8 percent to 66.6 percent to 64.6 percent to 60.6 percent of all design positions filled. She designers went from 31.6 percent to 32.2 percent to 33.4 percent to 35.1 percent to 39.3 percent. From 2015-16 to 2016-17, they designers went from 0.2 percent to 0.1 percent of all design positions filled each season. Over the five seasons studied, he designers filling positions decreased 7.8 percent, and she designers filling positions decreased 7.7 percent.
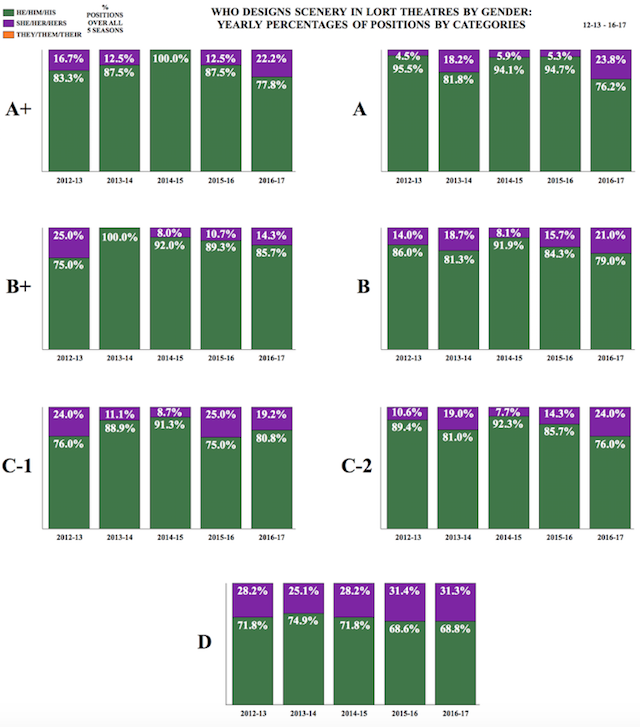
Who Designs Scenery in LORT Theatres by Gender: Yearly Percentages of Positions by Categories

In the A+ category from 2012-13 to 2016-17, he designers went from 83.3 percent to 87.5 percent to 100.0 percent to 87.5 percent to 77.8 percent of all scenic design positions filled each season. She designers went from 16.7 percent to 12.5 percent to 0.0 percent to 12.5 percent to 22.2 percent of all scenic design positions filled each season. Over the five seasons studied, he designers filling scenic design positions decreased 5.5 percent, while she designers filling scenic design positions increased 5.5 percent.
In the A category from 2012-13 to 2016-17, he designers went from 95.5 percent to 81.8 percent to 94.1 percent to 94.7 percent to 76.2 percent of all scenic design positions filled each season. She designers went from 4.5 percent to 18.2 percent to 5.9 percent to 5.3 percent to 23.8 percent of all scenic design positions filled each season. Over the five seasons studied, he designers filling scenic design positions decreased 19.3 percent, while she designers filling scenic design positions increased 19.3 percent.
In the B+ category from 2012-13 to 2016-17, he designers went from 75.0 percent to 100.0 percent to 92.0 percent to 89.3 percent to 85.7 percent of all scenic design positions filled each season. She designers went from 25.0 percent to 0.0 percent to 8.0 percent to 10.7 percent to 14.3 percent of all scenic design positions filled each season. Over the five seasons studied, he designers filling scenic design positions increased 10.7 percent, while she designers filling scenic design positions decreased 10.7 percent.
In the B category from 2012-13 to 2016-17, he designers went from 86.0 percent to 81.3 percent to 91.9 percent to 84.3 percent to 79.0 percent of all scenic design positions filled each season. She designers went from 14.0 percent to 18.7 percent to 8.1 percent to 15.7 percent to 21.0 percent of all scenic design positions filled each season. Over the five seasons studied, he designers filling scenic design positions decreased 7.0 percent, while she designers filling scenic design positions increased 7.0 percent.
In the C-1 category from 2012-13 to 2016-17, he designers went from 76.0 percent to 88.9 percent to 91.3 percent to 75.0 percent to 80.8 percent of all scenic design positions filled each season. She designers went from 24.0 percent to 11.1 percent to 8.7 percent to 25.0 percent to 19.2 percent of all scenic design positions filled each season. Over the five seasons studied, he designers filling scenic design positions increased 4.8 percent, while she designers filling scenic design positions decreased 4.8 percent.
In the C-2 category from 2012-13 to 2016-17, he designers went from 89.4 percent to 81.0 percent to 92.3 percent to 85.7 percent to 76.0 percent of all scenic design positions filled each season. She designers went from 10.6 percent to 19.0 percent to 7.7 percent to 14.3 percent to 24.0 percent of all scenic design positions filled each season. Over the five seasons studied, he designers filling scenic design positions decreased 13.4 percent, while she designers filling scenic design positions increased 13.4 percent.
In the D category from 2012-13 to 2016-17, he designers went from 71.8 percent to 74.9 percent to 71.8 percent to 68.6 percent to 68.8 percent of all scenic design positions filled each season. She designers went from 28.2 percent to 25.1 percent to 28.2 percent to 31.4 percent to 31.3 percent of all scenic design positions filled each season. Over the five seasons studied, he designers filling scenic design positions decreased 3.0 percent, while she designers filling scenic design positions increased 3.1 percent.
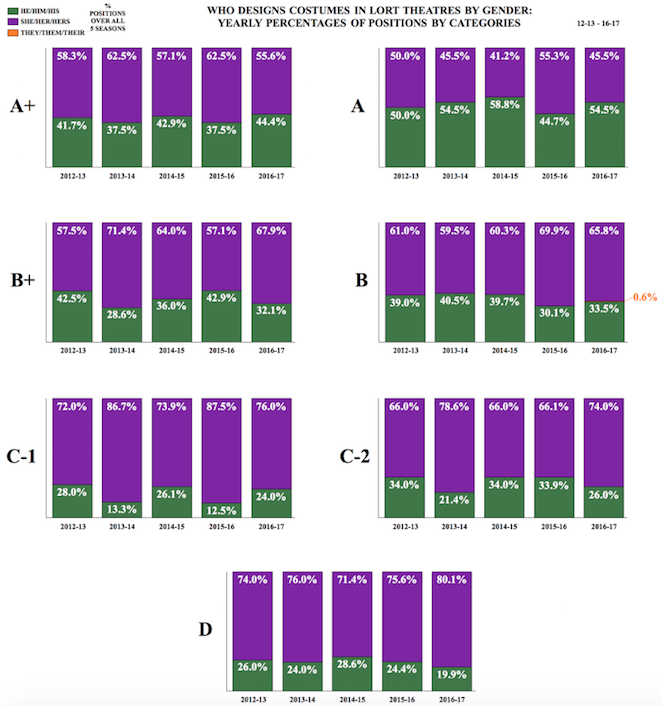
Who Designs Costumes in LORT Theatres by Gender: Yearly Percentages of Positions by Categories

In the A+ category from 2012-13 to 2016-17, she designers went from 58.3 percent to 62.5 percent to 57.1 percent to 62.5 percent to 55.6 percent of all costume design positions filled each season. He designers went from 41.7 percent to 37.5 percent to 42.9 percent to 37.5 percent to 44.4 percent. Over the five seasons studied, she designers filling costume design positions decreased 2.7 percent, and he designers filling costume design positions increased 2.7 percent.
In the A category from 2012-13 to 2016-17, she designers went from 50.0 percent to 45.5 percent to 41.2 percent to 55.3 percent to 45.5 percent of all costume design positions filled each season. He designers went from 50.0 percent to 54.5 percent to 58.8 percent to 44.7 percent to 54.5 percent. Over the five seasons studied, she designers filling costume design positions decreased 4.5 percent, and he designers filling costume design positions increased 4.5 percent.
In the B+ category from 2012-13 to 2016-17, she designers went from 57.5 percent to 71.4 percent to 64.0 percent to 57.1 percent to 67.9 percent of all costume design positions filled each season. He designers went from 42.5 percent to 28.6 percent to 36.0 percent to 42.9 percent to 32.1 percent. Over the five seasons studied, she designers filling costume design positions increased 10.4 percent, and he designers filling costume design positions decreased 10.4 percent.
In the B category from 2012-13 to 2016-17, she designers went from 61.0 percent to 59.5 percent to 60.3 percent to 69.9 percent to 65.8 percent of all costume design positions filled each season. He designers went from 39.0 percent to 40.5 percent to 39.7 percent to 30.1 percent to 33.5 percent. In 2016-17, they designers filled 0.6% of all costume design positions filled that season. Over the five seasons studied, she designers filling costume design positions increased 4.8 percent, and he designers filling costume design positions decreased 5.5 percent.
In the C-1 category from 2012-13 to 2016-17, she designers went from 72.0 percent to 86.7 percent to 73.9 percent to 87.5 percent to 76.0 percent of all costume design positions filled each season. He designers went from 28.0 percent to 13.3 percent to 26.1 percent to 12.5 percent to 24.0 percent. Over the five seasons studied, she designers filling costume design positions increased 4.0 percent, and he designers filling costume design positions decreased 4.0 percent.
In the C-2 category from 2012-13 to 2016-17, she designers went from 66.0 percent to 78.6 percent to 66.0 percent to 66.1 percent to 74.0 percent of all costume design positions filled each season. He designers went from 34.0 percent to 21.4 percent to 34.0 percent to 33.9 percent to 26.0 percent. Over the five seasons studied, she designers filling costume design positions increased 8.0 percent, and he designers filling costume design positions decreased 8.0 percent.
In the D category from 2012-13 to 2016-17, she designers went from 74.0 percent to 76.0 percent to 71.4 percent to 75.6 percent to 80.1 percent of all costume design positions filled each season. He designers went from 26.0 percent to 24.0 percent to 28.6 percent to 24.4 percent to 19.9 percent. Over the five seasons studied, she designers filling costume design positions increased 6.1 percent, and he designers filling costume design positions decreased 6.1 percent.
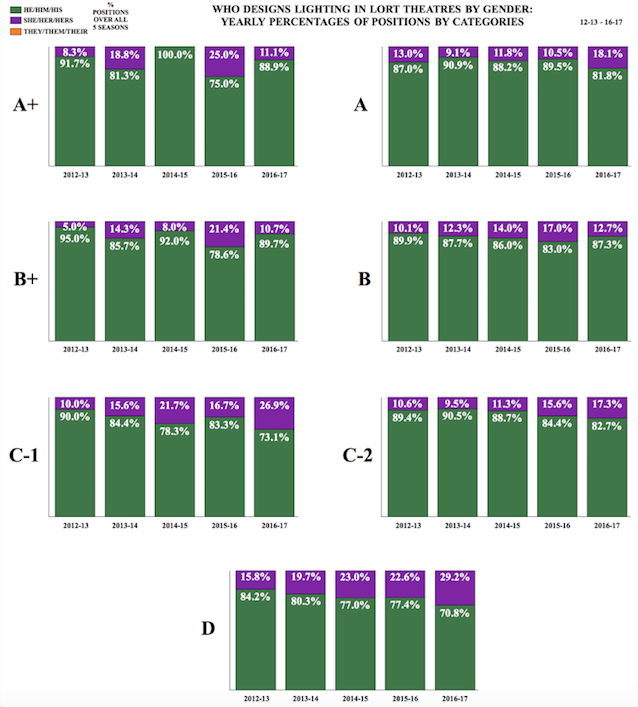
Who Designs Lighting in LORT Theatres by Gender: Yearly Percentages of Positions by Categories

In the A+ category from 2012-13 to 2016-17, he designers went from 91.7 percent to 81.3 percent to 100.0 percent to 75.0 percent to 88.9 percent of all lighting design position filled each season. She designers went from 8.1 percent to 18.8 percent to 0.0 percent to 25.0 percent to 11.1 percent. Over the five seasons studied, he designers filling lighting design positions decreased 2.8 percent, and she designers filling lighting design positions increased 2.8 percent.
In the A category from 2012-13 to 2016-17, he designers went from 87.0 percent to 90.9 percent to 88.2 percent to 89.5 percent to 81.8 percent of all lighting design position filled each season. She designers went from 13.0 percent to 9.1 percent to 11.8 percent to 10.5 percent to 18.2 percent. Over the five seasons studied, he designers filling lighting design positions decreased 5.2 percent, and she designers filling lighting design positions increased 5.2 percent.
In the B+ category from 2012-13 to 2016-17, he designers went from 95.0 percent to 85.7 percent to 92.0 percent to 78.6 percent to 89.7 percent of all lighting design position filled each season. She designers went from 5.0 percent to 14.3 percent to 8.0 percent to 21.4 percent to 10.7 percent. Over the five seasons studied, he designers filling lighting design positions decreased 5.7 percent, and she designers filling lighting design positions increased 5.7 percent.
In the B category from 2012-13 to 2016-17, he designers went from 89.9 percent to 87.7 percent to 86.0 percent to 83.0 percent to 87.3 percent of all lighting design position filled each season. She designers went from 10.1 percent to 12.3 percent to 14.0 percent to 17.0 percent to 12.7 percent. Over the five seasons studied, he designers filling lighting design positions decreased 2.6 percent, and she designers filling lighting design positions increased 2.6 percent.
In the C-1 category from 2012-13 to 2016-17, he designers went from 90.0 percent to 84.4 percent to 78.3 percent to 83.3 percent to 73.1 percent of all lighting design position filled each season. She designers went from 10.0 percent to 15.6 percent to 21.7 percent to 16.7 percent to 26.9 percent. Over the five seasons studied, he designers filling lighting design positions decreased 16.9 percent, and she designers filling lighting design positions increased 16.9 percent.
In the C-2 category from 2012-13 to 2016-17, he designers went from 89.4 percent to 90.5 percent to 88.7 percent to 84.4 percent to 82.7 percent of all lighting design position filled each season. She designers went from 10.6 percent to 9.5 percent to 11.3 percent to 15.6 percent to 17.3 percent. Over the five seasons studied, he designers filling lighting design positions decreased 6.7 percent, and she designers filling lighting design positions increased 6.7 percent.
In the D category from 2012-13 to 2016-17, he designers went from 84.2 percent to 80.3 percent to 77.0 percent to 77.4 percent to 70.8 percent of all lighting design position filled each season. She designers went from 15.8 percent to 19.7 percent to 23.0 percent to 22.6 percent to 29.2 percent. Over the five seasons studied, he designers filling lighting design positions decreased 13.4 percent, and she designers filling lighting design positions increased 13.4 percent.
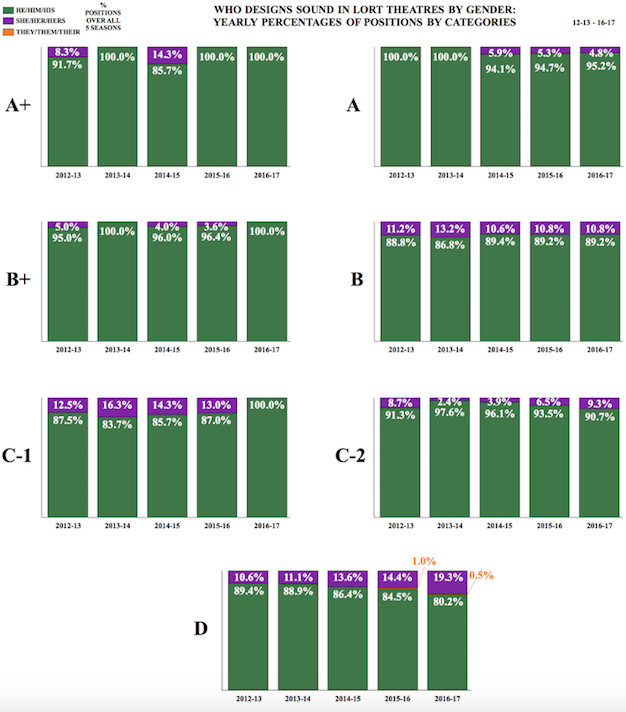
Who Designs Sound in LORT Theatres by Gender: Yearly Percentages of Positions by Categories

In the A+ category from 2012-13 to 2016-17, he designers went from 91.7 percent to 100.0 percent to 85.7 percent to 100.0 percent to 100.0 percent of all sound design positions filled each season. She designers went from 8.3 percent to 0.0 percent to 14.3 percent to 0.0 percent to 0.0 percent. Over the five seasons studied, he designers filling sound design positions increased 8.3 percent, and she designers filling sound design positions decreased 8.3 percent.
In the A category from 2012-13 to 2016-17, he designers went from 100.0 percent to 100.0 percent to 94.1 percent to 94.7 percent to 95.2 percent of all sound design positions filled each season. She designers went from 0.0 percent to 0.0 percent to 5.9 percent to 5.3 percent to 4.8 percent. Over the five seasons studied, he designers filling sound design positions decreased 4.8 percent, and she designers filling sound design positions increased 4.8 percent.
In the B+ category from 2012-13 to 2016-17, he designers went from 95.0 percent to 100.0 percent to 96.0 percent to 96.4 percent to 100.0 percent of all sound design positions filled each season. She designers went from 5.0 percent to 0.0 percent to 4.0 percent to 3.6 percent to 0.0 percent. Over the five seasons studied, he designers filling sound design positions increased 5.0 percent, and she designers filling sound design positions decreased 5.0 percent.
In the B category from 2012-13 to 2016-17, he designers went from 88.8 percent to 86.8 percent to 89.4 percent to 89.2 percent to 89.2 percent of all sound design positions filled each season. She designers went from 11.2 percent to 13.2 percent to 10.6 percent to 10.8 percent to 10.8 percent. Over the five seasons studied, he designers filling sound design positions increased 0.4 percent, and she designers filling sound design positions decreased 0.4 percent.
In the C-1 category from 2012-13 to 2016-17, he designers went from 87.5 percent to 83.7 percent to 85.7 percent to 87.0 percent to 100.0 percent of all sound design positions filled each season. She designers went from 12.5 percent to 16.3 percent to 14.3 percent to 13.0 percent to 0.0 percent. Over the five seasons studied, he designers filling sound design positions increased 12.5 percent, and she designers filling sound design positions decreased 12.5 percent.
In the C-2 category from 2012-13 to 2016-17, he designers went from 91.3 percent to 97.6 percent to 96.1 percent to 93.5 percent to 90.7 percent of all sound design positions filled each season. She designers went from 8.7 percent to 2.4 percent to 3.9 percent to 6.5 percent to 9.3 percent. Over the five seasons studied, he designers filling sound design positions increased 0.6 percent, and she designers filling sound design positions decreased 0.6 percent.
In the D category from 2012-13 to 2016-17, he designers went from 89.4 percent to 88.9 percent to 86.4 percent to 84.5 percent to 80.2 percent of all sound design positions filled each season. She designers went from 10.6 percent to 11.1 percent to 13.6 percent to 14.4 percent to 19.3 percent. From 2015-16 to 2016-17, they designers went from 1.0 percent to 0.5 percent of all sound design positions filled each season. Over the five seasons studied, he designers filling sound design positions decreased 9.2 percent, and she designers filling sound design positions increased 8.7 percent.
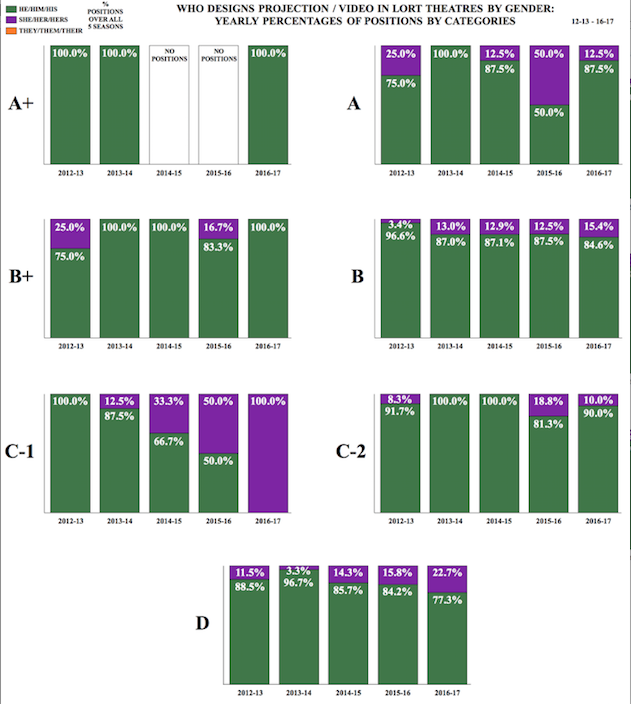
Who Designs Projection/Video in LORT Theatres by Gender: Yearly Percentages of Positions by Categories

Note: In comparison to other design disciplines, there were very few projection/video design positions, particularly in the earlier seasons analyzed.
In the A+ category from 2012-13 to 2016-17, he designers went from 100.0 percent to 100.0 percent to no positions for two seasons to 100.0 percent of all projection/video design positions filled each season. She designers went from 0.0 percent to 0.0 percent to no positions for two seasons to 0.0 percent. Over the five seasons studied, he designers filling projection/video design positions remained steady at 100.0 percent of the positions.
In the A category from 2012-13 to 2016-17, he designers went from 75.0 percent to 100.0 percent to 87.5 percent to 50.0 percent to 12.5 percent of all projection/video design positions filled each season. She designers went from 25.0 percent to 0.0 percent to 12.5 percent to 50.0 percent to 12.5 percent. Over the five seasons studied, he designers filling projection/video design positions increased 12.5 percent, and she designers filling projection/video design positions decreased 12.5 percent.
In the B+ category from 2012-13 to 2016-17, he designers went from 75.0 percent to 100.0 percent to 100.0 percent to 83.3 percent to 100.0 percent of all projection/video design positions filled each season. She designers went from 25.0 percent to 0.0 percent to 0.0 percent to 16.7 percent to 0.0 percent. Over the five seasons studied, he designers filling projection/video design positions increased 25.0 percent, and she designers filling projection/video design positions decreased 25.0 percent.
In the B category from 2012-13 to 2016-17, he designers went from 96.6 percent to 87.0 percent to 87.1 percent to 87.5 percent to 84.6 percent of all projection/video design positions filled each season. She designers went from 3.4 percent to 13.0 percent to 12.9 percent to 12.5 percent to 15.4 percent. Over the five seasons studied, he designers filling projection/video design positions decreased 12.0 percent, and she designers filling projection/video design positions increased 12.0 percent.
In the C-1 category from 2012-13 to 2016-17, he designers went from 100.0 percent to 87.5 percent to 66.7 percent to 50.0 percent to 0.0 percent of all projection/video design positions filled each season. She designers went from 0.0 percent to 12.5 percent to 33.3 percent to 50.0 percent to 100.0 percent. Over the five seasons studied, he designers filling projection/video design positions decreased 100.0 percent, and she designers filling projection/video design positions increased 100.0 percent.
In the C-2 category from 2012-13 to 2016-17, he designers went from 91.7 percent to 100.0 percent to 100.0 percent to 81.3 percent to 90.0 percent of all projection/video design positions filled each season. She designers went from 8.3 percent to 0.0 percent to 0.0 percent to 18.8 percent to 10.0 percent. Over the five seasons studied, he designers filling projection/video design positions decreased 1.7 percent, and she designers filling projection/video design positions increased 1.7 percent.
In the D category from 2012-13 to 2016-17, he designers went from 88.5 percent to 96.7 percent to 85.7 percent to 84.2 percent to 77.3 percent of all projection/video design positions filled each season. She designers went from 11.5 percent to 3.3 percent to 14.3 percent to 15.8 percent to 22.7 percent. Over the five seasons studied, he designers filling projection/video design positions decreased 11.2 percent, and she designers filling projection/video design positions increased 11.2 percent.
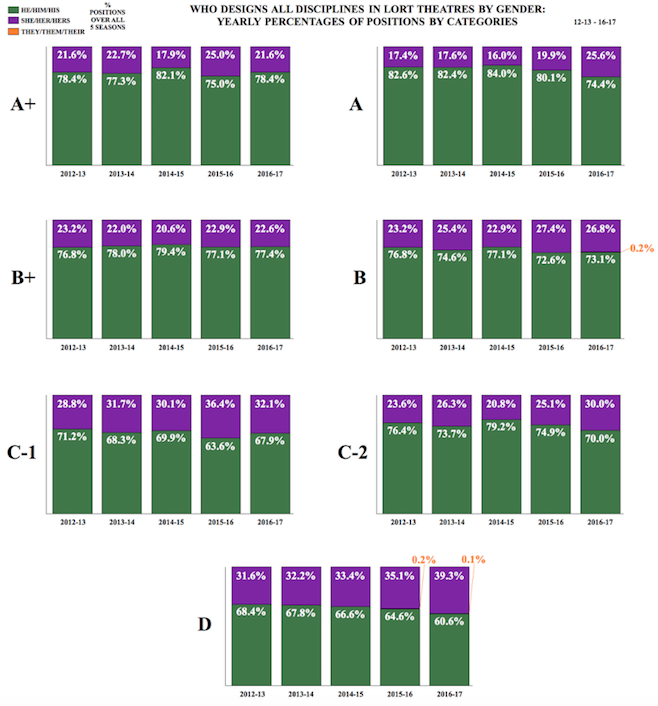
Who Designs All Discipline in LORT Theatres by Gender: Yearly Percentages of Positions by Categories

In the A+ category from 2012-13 to 2016-17, he designers went from 78.4 percent to 77.3 percent to 82.1 percent to 75.0 percent to 78.4 percent of all design positions filled. She designers went from 21.6 percent to 22.7 percent to 17.9 percent to 25.0 percent to 21.6 percent. Over the five seasons studied, he designers filling positions remained steady at 78.4 percent, and she designers filling positions remained steady at 21.6 percent.
In the A category from 2012-13 to 2016-17, he designers went from 82.6 percent to 82.4 percent to 84.0 percent to 80.1 percent to 74.4 percent of all design positions filled. She designers went from 17.4 percent to 17.6 percent to 16.0 percent to 19.9 percent to 25.6 percent. Over the five seasons studied, he designers filling positions decreased 8.2 percent, and she designers filling positions increased 8.2 percent.
In the B+ category from 2012-13 to 2016-17, he designers went from 76.8 percent to 78.0 percent to 79.4 percent to 77.1 percent to 77.4 percent of all design positions filled. She designers went from 23.2 percent to 22.0 percent to 20.6 percent to 22.9 percent to 22.6 percent. Over the five seasons studied, he designers filling positions increased 0.6 percent, and she designers filling positions decreased 0.6 percent.
In the B category from 2012-13 to 2016-17, he designers went from 76.8 percent to 74.6 percent to 77.1 percent to 72.6 percent to 73.1 percent of all design positions filled. She designers went from 23.2 percent to 25.4 percent to 22.9 percent to 27.4 percent to 26.8 percent. In 2016-17, they designers filled 0.2 percent of all design positions filled. Over the five seasons studied, he designers filling positions decreased 3.7 percent, and she designers filling positions increased 3.6 percent.
In the C-1 category from 2012-13 to 2016-17, he designers went from 71.2 percent to 68.3 percent to 69.9 percent to 63.6 percent to 67.9 percent of all design positions filled. She designers went from 28.8 percent to 31.7 percent to 30.1 percent to 36.4 percent to 32.1 percent. Over the five seasons studied, he designers filling positions decreased 3.3 percent, and she designers filling positions increased 3.3 percent.
In the C-2 category from 2012-13 to 2016-17, he designers went from 76.4 percent to 73.7 percent to 79.2 percent to 74.9 percent to 70.0 percent of all design positions filled. She designers went from 23.6 percent to 26.3 percent to 20.8 percent to 25.1 percent to 30.0 percent. Over the five seasons studied, he designers filling positions decreased 6.4 percent, and she designers filling positions increased 6.4 percent.
In the D category from 2012-13 to 2016-17, he designers went from 68.4 percent to 67.8 percent to 66.6 percent to 64.6 percent to 60.6 percent of all design positions filled. She designers went from 31.6 percent to 32.2 percent to 33.4 percent to 35.1 percent to 39.3 percent. From 2015-16 to 2016-17, they designers went from 0.2 percent to 0.1 percent of all design positions filled each season. Over the five seasons studied, he designers filling positions decreased 7.8 percent, and she designers filling positions decreased 7.7 percent.


Comments
The article is just the start of the conversation—we want to know what you think about this subject, too! HowlRound is a space for knowledge-sharing, and we welcome spirited, thoughtful, and on-topic dialogue. Find our full comments policy here.